Unlock a world of possibilities! Login now and discover the exclusive benefits awaiting you.
- Qlik Community
- :
- Forums
- :
- Groups
- :
- Industry and Topics
- :
- Scalability
- :
- Scalability Results Analyzer
- Subscribe to RSS Feed
- Mark Topic as New
- Mark Topic as Read
- Float this Topic for Current User
- Bookmark
- Subscribe
- Mute
- Printer Friendly Page
- Feature this Topic
- Mark as New
- Bookmark
- Subscribe
- Mute
- Subscribe to RSS Feed
- Permalink
- Report Inappropriate Content
Scalability Results Analyzer
QSSTAnalyzer.zip
This package contains a Qlik Sense app, which can be used for analyzing Qlik Sense performance test results generated by the Qlik Sense Scalability Tools and the Qlik Sense Enterprise Scalability Tools.
Included parts:
- QSSTAnalyzer.qvf
- GopherciserTest: A test results folder
- FolderTemplate.zip: A template of folder structure
SCResultAnalyzer.zip
This package (referred to as SC Results Analyzer) contains a set of QlikView documents, which can be used for analyzing both QlikView and Qlik Sense performance test results generated by the Qlik Sense Scalability Tools and the QV Scalability Tools.
Included parts:
- QVD Generator.qvw
- ServerMetaFetcher.qvw
- SC_Results - DemoTest.qvw: An analyzer for test results
- DemoTest: A Demo test results folder
- FolderTemplate.zip: A template of folder structure
------------------------------------------------------------------------------------------------------------------------------------------
Update 2021-01-04:
- Bugfix for missing DataFiles connector
Update 2020-12-18:
- Bugfix for session counts
Update 2019-11-14:
- Added default values and "only one selected" for key visualization dimensions in the QSSTAnalyzer app
Update 2019-10-31:
- Added API fields
- Added "Gopherciser, Metric" sheet for API data analysis
Update 2019-10-14:
- New QSSTAnalyzer user interface
- Improved QSSTAnalyzer capabilities
- Added support for using QSSTAnalyzer in Qlik Sense Enterprise on Cloud Services (QCS)
Update 2019-05-17:
- New version of QSSTAnalyzer with added support for data from Qlik Sense Enterprise Scalability Tools
- Added sample data from Qlik Sense Enterprise Scalability Tools
Update 2017-09-26:
- New version of the SCResultAnalyzer updated for the QV12 Hardware Benchmark Package
Update 2017-03-17:
- Added QSSTAnalyzer
Your use of Scalability Tools will be subject to the same license agreement between you and Qlik. Qlik does not provide maintenance or support services for the SC Result Analyzer and QSSTAnalyzer, however please check Qlik community for additional information on its use.
- « Previous Replies
- Next Replies »
Accepted Solutions
- Mark as New
- Bookmark
- Subscribe
- Mute
- Subscribe to RSS Feed
- Permalink
- Report Inappropriate Content
Are you using the full folder structure?
Are the logs placed in the correct folder?
I suspect that you have placed the files in the Gopherciser-folder.
The Qlik Sense Scalability Tools result logs should be placed in the Exerciser-folder.
Yes, the field naming is inconsistent and that's why there are more than one folder for results.
Un-zip the FolderTemplate.zip and place the result files, ending with _scenario.txt, in the Exerciser folder instead.
/lars
- Mark as New
- Bookmark
- Subscribe
- Mute
- Subscribe to RSS Feed
- Permalink
- Report Inappropriate Content
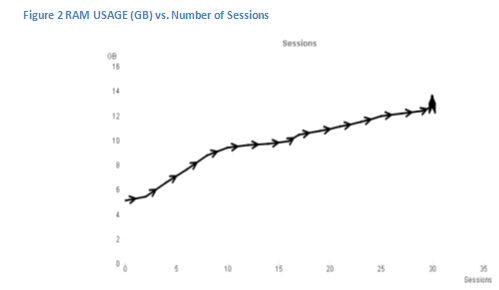
I wanted to propose additional graphs for analyzing results
(Chart below makes sense for testing a single document.)
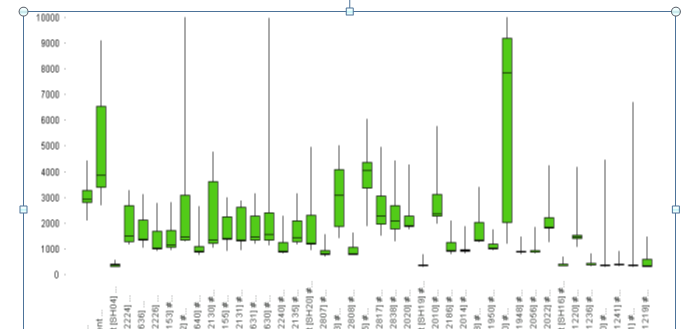
And response times by test case
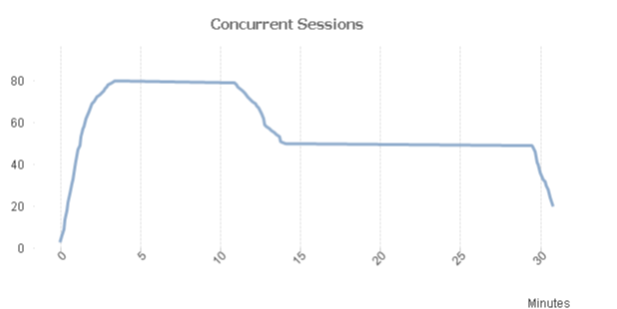
and number of concurrent sessions with test duration:
- Mark as New
- Bookmark
- Subscribe
- Mute
- Subscribe to RSS Feed
- Permalink
- Report Inappropriate Content
dlo
We made some changes to the SC_Results script in order to properly link the data:
/****** LINKTABLE **********/
Original:
TestMachine & '-' & %KEY_TimeSlot AS %KEY_MachineTimeSlot
Changed to:
TestMachine & '-' & Timestamp(Left(%KEY_TimeSlot, Len(%KEY_TimeSlot)-1),'YYYY-MM-DD hh:mm') & '-' AS %KEY_MachineTimeSlot
/*****PerformanceCounters********/
Original:
ServerName & '-' & KEY_TimeSlot & '-' AS %KEY_MachineTimeSlot
Changed to:
ServerName & '-' & Timestamp(KEY_TimeSlot,'YYYY-MM-DD hh:mm') & '-'
AS %KEY_MachineTimeSlot
/*****Events********/
Original:
ServerNameEvent & '-' & %KEY_TimeSlot AS %KEY_MachineTimeSlot
Changed to:
ServerNameEvent & '-' & left(%KEY_TimeSlot,16) & '-' AS %KEY_MachineTimeSlot,
/*****Sessions********/
Original:
ServerNameEvent & '-' & %KEY_TimeSlot AS %KEY_MachineTimeSlot
Changed to:
ServerNameEvent & '-' & left(%KEY_TimeSlot,16) & '-' AS %KEY_MachineTimeSlot,
Any chance you can investigate that and include it in the next release?
- Mark as New
- Bookmark
- Subscribe
- Mute
- Subscribe to RSS Feed
- Permalink
- Report Inappropriate Content
Hi,
Thanks you for your suggestion. Just wondering, under which circumstances is it you get the problem?
- Mark as New
- Bookmark
- Subscribe
- Mute
- Subscribe to RSS Feed
- Permalink
- Report Inappropriate Content
Hi Daniel,
I've just reviewed the original code and the issue seems to be somewhere else. I've reverted the changes one by one and commented out only one line in the PerformanceCounters tab:
Where Exists(TimeSlot, PCTimeSlot)
I understand that the line is there to only keep the data that is relevant to the test. The issue I had was that even though TimeSlot and PCTimeSlot looked the same, for some records they were different:
i.e.
2016-09-22 09:56 <>2016-09-22 09:56:00 , but
2016-09-22 09:55 = 2016-09-22 09:55:00
In order to make it work I created two text fields:
Text(Timestamp(KEY_TimeSlot,'YYYY-MM-DD hh:mm'))
as TextPCTimeSlot
in the PerformanceCounters, and
text(Timestamp(Left(JMeter_TimeSlot, Len(JMeter_TimeSlot)-3), 'YYYY-MM-DD hh:mm'))
AS TextTimeSlot
in the Calendar, and apply the where exist on the two text fields:
Where Exists(TextTimeSlot, TextPCTimeSlot).
- Mark as New
- Bookmark
- Subscribe
- Mute
- Subscribe to RSS Feed
- Permalink
- Report Inappropriate Content
Running the tool with QV 11-20 SR15, I cannot get info for sessions in the QVS. The expression seems to use fields that are not the the analyzer QVW, such as ActiveUserId, ServiceLogType or ServiceLogName. I'm missing other files? I can see the sessions running the old QVW
- Mark as New
- Bookmark
- Subscribe
- Mute
- Subscribe to RSS Feed
- Permalink
- Report Inappropriate Content
Miguel Baeyens wrote:
Running the tool with QV 11-20 SR15, I cannot get info for sessions in the QVS. The expression seems to use fields that are not the the analyzer QVW, such as ActiveUserId, ServiceLogType or ServiceLogName. I'm missing other files? I can see the sessions running the old QVW
I assume you're taking about the session information in the "Extra" tab. This information comes from the qlikview session log. To see this information you need to
- Make sure you get the session log from the server/servers
- Make sure you get the log after the sessions has been written to the log. The sessions are not written until either the session times out (by default 30 minutes after last user action) or engine restarts.
- Make sure to put the log in the SessionLogs folder for QVD Generation.
In other words you should either wait 30mins after the test (provided default timeout) or restart the qvs before getting the log.
- Mark as New
- Bookmark
- Subscribe
- Mute
- Subscribe to RSS Feed
- Permalink
- Report Inappropriate Content
I'm talking about the following objects
Main tab:
Sessions chart
Extra tab:
Session distribution
Sessions and connections
Logs:
Engine, Session
Print Object:
Sessions
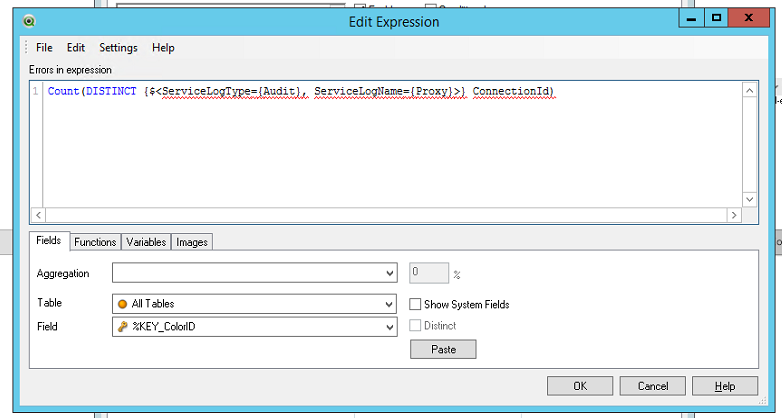
As I say in the previous post, I do have the session logs (mostly by restarting the QlikView Server service so the sessions are written) and if I use the old Analyzer.qvw, I can see the sessions. In the newer one, however, the expressions in these charts use fields that are not in the data model, screenshot attached. ServiceLogType, ServiceLogName do not exist in the data model, hence the chart showing nothing.
- Mark as New
- Bookmark
- Subscribe
- Mute
- Subscribe to RSS Feed
- Permalink
- Report Inappropriate Content
The expression you show in the screenshot is for proxy and will only be in the data model if you have a sense log files. For the normal session graph you should see sessions provided your scripts has reached opendoc actions (the session graph counts opendoc for qlikview or openapp for sense). So some questions to verify.
- Is it the exact same data you are comparing? (i.e. to be sure you actually see the in the old analyzer)
- The QVD's created will differ and can't be reused, did make sure the qvd's was regenerated or deleted before using the new qvdgenerator?
- Did you make sure the timezone was set correctly when creating qvd's?
- Mark as New
- Bookmark
- Subscribe
- Mute
- Subscribe to RSS Feed
- Permalink
- Report Inappropriate Content
Daniel, I'm copying the logs in two different folders, one where the old QVW Analyzer is, another where the new is. So I reload both QVD Generators, make sure the server names are OK, etc. then load from there to the results. Timezone is the same that the one on my laptop, anyway, I'm loading all logs in the server, so I guess even if it was wrong, since all Jmeter, Scalability Tools and QlikView are on the same server, the time should be the same for all.
What I don't get yet is how the app knows when QlikView or Qlik Sense logs have been loaded, I mean, is there any setting I should change on the QVW itself? There is no Qlik Sense services at all in these servers, only QlikView and all of them running the same version.
I think I can share with you a reduced version (one or two minutes worth of test) and you can tell me what I'm doing wrong
- « Previous Replies
- Next Replies »