Unlock a world of possibilities! Login now and discover the exclusive benefits awaiting you.
- Qlik Community
- :
- Forums
- :
- Groups
- :
- Industry and Topics
- :
- Scalability
- :
- Test result reports - Average response time
- Subscribe to RSS Feed
- Mark Topic as New
- Mark Topic as Read
- Float this Topic for Current User
- Bookmark
- Subscribe
- Mute
- Printer Friendly Page
- Feature this Topic
- Mark as New
- Bookmark
- Subscribe
- Mute
- Subscribe to RSS Feed
- Permalink
- Report Inappropriate Content
Test result reports - Average response time
I've generated test results for an app and loaded all the logs (scenario text files) and performance counter logs in the Qlik Sense app. After the load - the graphs are updated in the sheet(s) that shows average response time.
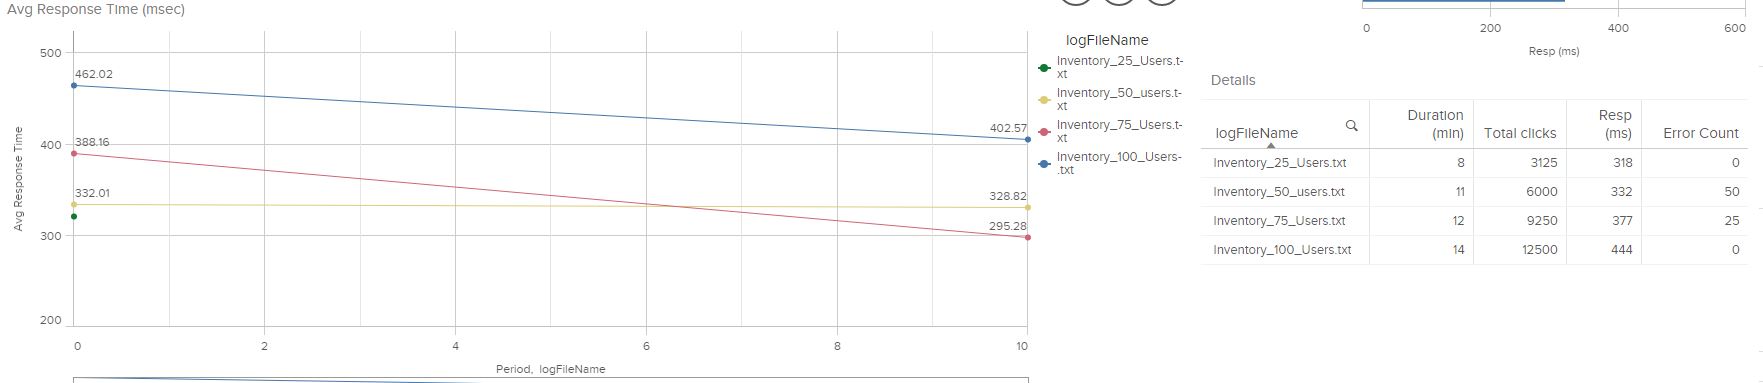
The X-axis of this visual has Period which numbers from 0 to 10 - what exactly is this period? See screenshots below.
Sheet - Totals

Sheet - Totals by TestName
Another issue is - sheets System Resource Utilization (%) By Test Name and System Resource Utilization (%) By Process (Stacked) are not displaying the charts. Is there any step I am missing?

I've updated TestLogMeta text file (see attached) and placed in the results folder that has the below structure. Folders underlined in red has the log files and server information.

- Tags:
- Group_Discussions
- Mark as New
- Bookmark
- Subscribe
- Mute
- Subscribe to RSS Feed
- Permalink
- Report Inappropriate Content
Hi,
The Period is a calculated dimension based on the selections made in TimeSelector & TimeGranularity. Default values are relative time and timegranularity of 10 minutes, which means there will be shown one sample per full 10 minutes of the test.
For your second question, I assume there is a problem reading & connecting performance counters to the test result file. Some considerations:
- Both load client machine and the server needs to be in the same time zone
- The performance counter file(s) needs to be in english
When performance counters are read in, it will only be for the time interval of the test. It is a good idea to doublecheck in the performance counter file that you have samples from when the test did run.
If the above doesn't help, get back to us and we will try and solve the issue. It could be something with the naming of the server in the exerciserfile and/or the performance counter file.
Regards,
Sebastian
- Mark as New
- Bookmark
- Subscribe
- Mute
- Subscribe to RSS Feed
- Permalink
- Report Inappropriate Content
Thanks Sebastian. This is really helpful to understand the response time visuals. So more time I run the test then I can get more samples. Currently I am running the test with a maximum load of 100 concurrent users (and 25 iterations) and this test is being completed in 12-15 minutes. So that is why I see one or two averages.
If I need to run the test for more time, I need to increase iterations/concurrent users or both. Is that correct?
For the server logs issue
I am sure the response files are in English but I will check the time zone and verify the samples before loading to get the data in visuals.
Thank you so much for all your help 
- Mark as New
- Bookmark
- Subscribe
- Mute
- Subscribe to RSS Feed
- Permalink
- Report Inappropriate Content
Hi,
The amount of concurrent users have no big impact on the length of the scenario, only to a minor degree if you have a high rampupdelay (time between each new user thread is created).
The time spent simulating users are controlled primarily with setting ExecutionTime to how long time you want the test to run (3600 is one hour for example). You can also use iterations, that will mean how many times each simulated user will execute the scenario - so if each run takes about 5 minutes (adding all wait timers and response times) then 12 iterations will equal about 1 hour of total test time.
Regards
Sebastian