Unlock a world of possibilities! Login now and discover the exclusive benefits awaiting you.
Analytics & AI
Forums for Qlik Analytic solutions. Ask questions, join discussions, find solutions, and access documentation and resources.
Data Integration & Quality
Forums for Qlik Data Integration solutions. Ask questions, join discussions, find solutions, and access documentation and resources
Explore Qlik Gallery
Qlik Gallery is meant to encourage Qlikkies everywhere to share their progress – from a first Qlik app – to a favorite Qlik app – and everything in-between.
Qlik Community
Get started on Qlik Community, find How-To documents, and join general non-product related discussions.
Qlik Resources
Direct links to other resources within the Qlik ecosystem. We suggest you bookmark this page.
Qlik Academic Program
Qlik gives qualified university students, educators, and researchers free Qlik software and resources to prepare students for the data-driven workplace.
Recent Blog Posts
-
The Qlik Sense Beginner's Workshop
Recently my colleague Lee Matthews made me aware of a comprehensive set of videos he created based off of a free, 3 hour workshop he and his team hold... Show MoreRecently my colleague Lee Matthews made me aware of a comprehensive set of videos he created based off of a free, 3 hour workshop he and his team hold on a regular basis in the ANZ region. (Australia / New Zealand). 3 hours may not seem like a long time, however it is enough time to build a rather sophisticated Qlik Sense app from start to finish. They utilize Qlik Sense Cloud as a basis for the workshop; providing a turnkey approach that requires no setup and fast delivery. Qlik Sense Cloud provides a great introduction to Qlik Sense and while it does not have all the features of the Qlik Sense Enterprise platform, the process involved in building a Qlik Sense App is the same. To further our goal of delivering analytics and insights to everyone Lee has condensed the workshop into (5) 8-15 min videos; totaling about 50 min viewing time. Watch these videos at your own leisure and even download the workshop material (attached to this document) to follow along. I hope you find these videos helpful! Thanks for this valuable contribution Lee!
This is just another fine example of contagious enthusiasm demonstrated by our Qlik team members whom are dedicated to our customer's success.
About Lee Matthews: Lee is a Principal Solution Architect and team lead with Qlik and is based in Melbourne, Australia. He joined Qlik in 2011 but has been working in the Business Intelligence field with various ERP and CRM vendors for over 20 years. Prior to that he was a management accountant. He therefore has a long history of working with data and reporting systems for organizations. When not tinkering with Qlik applications for clients, he enjoys tinkering with robots, making things out of wood and teaching these skills to his two boys.
Have a comment or question? Want to suggest a post? Let us know in the comments below?

-
Meet Our Updated Developer Experience, taking Qlik Branch to New Heights!
Happy Day of the Programmer! As the 256th day of the year, developers are celebrated on this day based on binary code — an important concept within c... Show More Happy Day of the Programmer! As the 256th day of the year, developers are celebrated on this day based on binary code — an important concept within computer science. You see, 1 Byte consists of 8 Bits. It has 2^8 or 256 possible values. Translated to binary code, the day reads 1 0000 0000. These values are well-known to developers making it the perfect day to celebrate their contributions.
That also why today we’re unveiling Qlik Branch’s fresh new look and UX. Built on top of the Qlik Associative Engine, the new site experience at https://developer.qlik.com is the developer gateway for experiencing the power of our Associative Engine and APIs. It features:- Qlik Branch Garden — a hub for developers to share and collaborate on open source projects that ignite innovation leveraging Qlik products
- Qlik Branch Playground — a sandbox for developers to experience the power of Qlik Core for free by running their data through the Qlik Associative Engine to quickly explore, create, share and test their application ideas — right in their browser.
- Qlik Branch Knowledge — tutorials and hacks from Qlik’s developer relations team and squad of 30,000+ developers
Across the site, you can favorite, upvote, downvote and provide comments to content. You can also curate your own content via your user profile page and get the latest on upcoming events and news. So, whether you’re a seasoned developer or just beginning your developer journey, join our Qlik Branch Squad!Also, share your feedback and roadmap ideas via the #branch-website Qlik Branch Slack channel. And if you’re really a fan of the new experience, be sure to share on social using #NewBranchOut. -
Speak data, be data literate!
If I ask you what the alpha value means in hypothesis testing, I’d bet most of you would be able to give a correct answer right away, am I right? But ... Show MoreIf I ask you what the alpha value means in hypothesis testing, I’d bet most of you would be able to give a correct answer right away, am I right? But you are a minority, most people in the world wouldn’t have a clue – only about 1 in 5 people today are data literate.
Data literacy is the ability to read, work with, analyze, and argue with data
Some of you might argue that 4 in 5 people doesn’t really need to know what alpha value is, and surely, not everybody needs to be a data master, however being able to speak data, would help everyone, everywhere. It might give you and edge now but surely it will be vital in the future.
But, let’s focus in the Enterprise, what if we turn our heads to the people making business decisions? Should they be data literate?
A new research shows only 24% of business decision makers, from junior managers to the C-suite, feel fully confident in their ability to read, work with, analyze and argue with that data.
We have a problem
If only 24% of business decision makers can speak data, then it means we have a problem. But don’t worry, we have a plan. Qlik is on a mission to solve this important skills gap, by empowering everyone with the ability to properly use data.

We can help to fix it, and it’s free!
Qlik is offering free courses that everyone can benefit from – regardless of their role, skill level, or even the BI tools they use – designed to help people and organizations understand, analyze and use data with confidence.
Qlik’s learning program, is a product agnostic training package, designed to help anyone to read, work, analyze and argue with data.

Get started now by taking the FREE Data Literacy Skills Assessment it's a fun 15-minute questionnaire that will tell you where you are in data literacy and what next steps you should take. Then progress to the self-paced learning modules and finally complete the program by taking the free certification exam.
Some reading about the topic: https://blog.qlik.com/posts/topics/data-literacy-topic/
I hope you find it interesting,
Arturo (@arturoqv)

-
Qlik and the Center of Business Analytics at Villanova University
Qlik was onsite at the Center of Business Analytics at Villanova University to host a workshop for undergraduate students minoring in analytics. The ... Show More
Qlik was onsite at the Center of Business Analytics at Villanova University to host a workshop for undergraduate students minoring in analytics. The audience ranged from marketing students to finance students but everyone had one thing in common, they were all eager to add Qlik Sense to their skill set. Not only did the workshop provide students the opportunity to learn Qlik Sense Desktop but it showed students all the amazing and FREE resources that were available to them if they joined Qlik's Academic Program. We are eager to return shortly to present to the graduate students!

-
Meet the New Kid on the Block, Qlik Core is here!
We are excited to introduce Qlik Core to the market after our recent beta testing. Qlik Core is a set of components that allows software developers t... Show MoreWe are excited to introduce Qlik Core to the market after our recent beta testing. Qlik Core is a set of components that allows software developers to easily integrate and scale the power of Qlik’s Associative Engine for their own software and platform projects.
The why.
It all started with the release of QlikView 10 when we introduced the ability for software developers to build their own set of objects that could be used within a QlikView document. This opened the door to a new audience of software developers, enabling them to extend Qlik’s platform.
When we designed Qlik Sense we took it a step further. We gave software developers even more possibilities. The idea was to allow users the ability to tap into the Associative Engine directly and extend every aspect of the platform. This allowed developers to create new data driven experiences on top of the Qlik Sense platform bringing it to new heights than we never could have imagined.Now the time has come to push the boundaries even further!
The what.
With Qlik Core we are scaling back even further and are allowing software developers to consume the Qlik Associative Engine with minimal amount of dependencies. Allowing the developer to craft a data driven experience that is 100% their own while we get out of the way.
Qlik Core consists of the Qlik Associative Engine packaged up as a Docker image running in a UNIX container and various, optional, libraries to help speed up the development cycle.
With this, we also deliver additional tools and services to allow developers to easily orchestrate and scale usage of Qlik Core inside of their own software projects.The “THIS SOUNDS AMAZING AND I WANT TO GET STARTED RIGHT AWAY!”
And you can! Qlik Core is free to use for development and testing purposes where no licenses are needed to get started. Qlik Branch Playground allows developers to experience the power of Qlik Core for free by running their data through the Qlik Associative Engine to quickly explore, create, share and test their application ideas — right in their browser.
Head over to our Qlik Core site for more information or visit our getting started guides to experience the full power of Qlik’s Associative Engine.
-
Qlik Geocoding ® - Street Addresses and Qlik GeoAnalytics
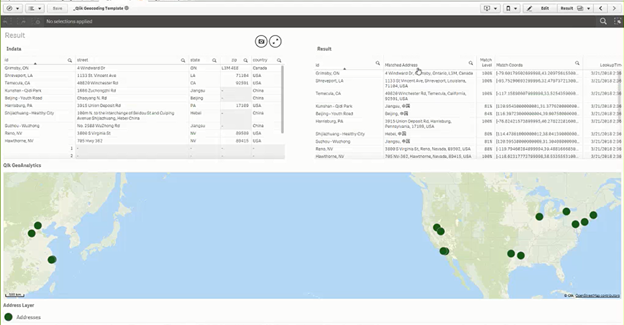
For most geo-related use cases, the highest level of needed detail is the town or postal code district. There are, however, certain use cases where on... Show MoreFor most geo-related use cases, the highest level of needed detail is the town or postal code district. There are, however, certain use cases where one needs to also include street addresses. And for that, Qlik now offers Qlik Geocoding. Initially released this past April, Qlik Geocoding is an optional, add-on subscription service to Qlik GeoAnalytics Base and Qlik GeoAnalytics Enterprise Server that determines the coordinates of a street address or the other way around.
The service is provided through the Qlik GeoAnalytics Connector (for both QlikView and Qlik Sense) using the operations “AddressPointLookup” and “PointToAddressLookup”. “AddressPointLookup” is used for forward geocoding (given this address, what are the coordinates). “PointToAddressLookup” is used for reverse geocoding or converting coordinates to an address. This could be useful, for example, to convert GPS coordinates to a street location.
An example of forward geocoding can be seen in this screenshot. The original addresses are in the table on the left. The related coordinates that were returned by Qlik Geocoding are in the table on the right.
Qlik’s source of geocoding information is the Esri World Geocoding Service and, like any mapping source, the completeness and level of detail will vary by country. Countries with rich datasets should accurately return the correct house number. Countries with limited datasets may only be able to match to the street or region, not the address.
Qlik Geocoding is only offered as a hosted service and is subscription priced based on how many lookups are done each year. Because of this, we recommend that you store all completed look-up results locally for future reference. Thus, you only need to use Qlik Geocoding in the future for new addresses. This can significantly reduce the number of address lookups and thus minimize the cost of using Qlik Geocoding.
To learn more about our Qlik Geocoding service check out this video by our Mike Tarallo, which provides a brief presentation about the service and a more in depth how-to with some tips and tricks along the way. Mike has also provided some sample data and a Qlik Sense example as well for you to use within your Qlik Sense implementation. Also see his next video which covers the Line Layer and the use of the "Closest" operator with the Qlik GeoAnalytics Connector: Get Familiar with Qlik GeoAnalytics - The "Closest" Operator.
Resources mentioned in this video:
• https://help.qlik.com/en-US/geoanalytics/Content/Home.htm/
• Geocoding Template: https://bi.idevio.com/products/qlik-geocoding
More Qlik GeoAnalytics Videos and Blogs:

-
The Qlik Sense June 2018 Release has Arrived!
As the summer months begin to heat up so too are things here at Qlik with the much-anticipated Qlik Sense June 2018 Release. Packed with so many great... Show MoreAs the summer months begin to heat up so too are things here at Qlik with the much-anticipated Qlik Sense June 2018 Release. Packed with so many great new features, and it is hard to know where to start...
What's New in Qlik Sense June 2018 (.mp4 video below)
To begin with, say hello to the Insight Advisor as our newest and very exciting advancement in Augmented Intelligence (AI). The Insight Advisor suggests the best analytics and insights for users to consider and explore. This capability, powered by our cognitive engine and works with our Qlik Associative Engine to provide insight suggestions and automation that are in context with user’s intuition and behavior to support our vision around pervasive data literacy within the organization. In short, this very cool feature is only the beginning of how our cognitive engine will continue to reshape the analytics community.
New features around accelerated self-service help users get to insights that much faster. Qlik’s cognitive engine also powers alternative chart suggestions, which allows users to explore different chart options easily. Simple drag-and-drop functionality enable users to easily switch dimensions and measures to drive a quicker and more intuitive way to visualize data. We also made advancements around data loading capabilities providing a user-friendly and integrated way to control the loading of your data, with easily applied filters and aggregations.
As always, we are continually developing new visualizations and enhanced mapping capabilities. This release boasts a new line layer map chart, which allows users to visualize relationships such as areas or flows of goods, or money between geographic locations. A scrollbar chart toggle feature allows users to toggle off a visualization’s scrollbar on charts when using the continuous axis to control the appearance and make better use of the sheet’s space to highlight other chart aspects. Lastly, we are giving users more control over the straight table with the ability to show or hide columns conditionally based on expressions.
We are also introducing Accessibility capabilities with this release. Chart to table flipping allows a user to switch visualizations to a table presentation, inspect values and make selections. Keyboard table selections enable value selection in charts that have been flipped to a table. In addition, we have added screen reader tags that can be read out properly to the user when using a screen reader program. Lastly, users can navigate and interact with the Qlik help site using keyboard keys and shortcuts, resize/zoom text and images and get a good contrast for text, icons, and images.
We are committed to enhancing ways to collaborate across the organization using the QSE platform, and the June 2018 Release supports this with a new “My Work” section within the hub. Now users can easily identify apps in this section that are published and those that are not giving users more control around publishing apps. Owners of apps can also promote and un-promote community sheets, which provides great value when promoting a compelling insight that might add value for other users in the system as authorized content to the “base sheets”
Improved management and governance capabilities for app republishing from the hub eliminate the need to browse the QMC and simplifies the app lifecycle workflow. This release also provides improvements to our API to export / import an app with or without data, and ability to import & replace an app UI while keeping the data.
As written up in a recent innovation blog, Qlik is focused on building out capabilities around “Advanced Authoring” capabilities in Qlik Sense! Specific to this release, we have improved sheet layout options, which now include scrollable sheets and control over grid size with objects. You will also see an improved set of options around creating expressions, which allows users to easily explore and see expected syntax for all Qlik Sense chart functions from the Editor dialog.
Last and quite possibly the biggest part of the June 2018 Release, is the launch of our Multi-Cloud offering, which will give customers a way to successfully transition to cloud analytics! Qlik’s multi-cloud analytics solution supports any analytics use case regardless of where data is stored or how the platform is deployed. This will allow Qlik customers to keep their data where they want it – across on-premise and single- or multi-cloud deployments using clouds of their choice. Customers can define their own rules and policies around where data is stored and how it is distributed to optimize computing across different environments and provide a seamless experience across their infrastructure.
With the release of Multi-Cloud we also offer a new cloud hub, which delivers a flexible, modern and personalized view of analytics to all consumers of cloud content in multi-cloud deployments of Qlik Sense. The new cloud hub allows users to organize content in collections and easily get to commonly used apps by favoriting them. This works on any device, as it is built using responsive design. Over the next few releases, the cloud hub will add more features to accelerate time to insight for all users.
Qlik is also introducing updates that streamline the Qlik Sense client packaging with the introduction of Webpack , a new technology for module bundling JavaScript® applications.
All this, and more including Qlik Nprinting enhancements and expanded connectivity!
You can watch the video above or visit our YouTube channel to learn more: Qlik Sense June 2018 - What's New - YouTube
Other Resources:
- Qlik Sense June 2018 Help
- Qlik Sense June 2018 Features Playlist
- Qlik's Multi-Cloud Solution - Part 1 - Introduction - YouTube
- Qlik's Multi-Cloud Solution - Part 2 - Brief Demonstration (Phase 1) - YouTube
- Qlik Multi-Cloud Features Playlist
Can't see the video? YouTube blocked by your region or organization? Download the attached .mp4 to watch on your computer or mobile device.
-
Inspecting Qlik Sense Websocket Communication
Inspecting Qlik Sense websocket communication is useful for a variety of reasons. Let’s see how to inspect websocket traffic, and then what to look fo... Show MoreInspecting Qlik Sense websocket communication is useful for a variety of reasons. Let’s see how to inspect websocket traffic, and then what to look for when it comes to websocket traffic from the Qlik Sense Engine.
HOW TO INSPECT WEBSOCKET TRAFFIC
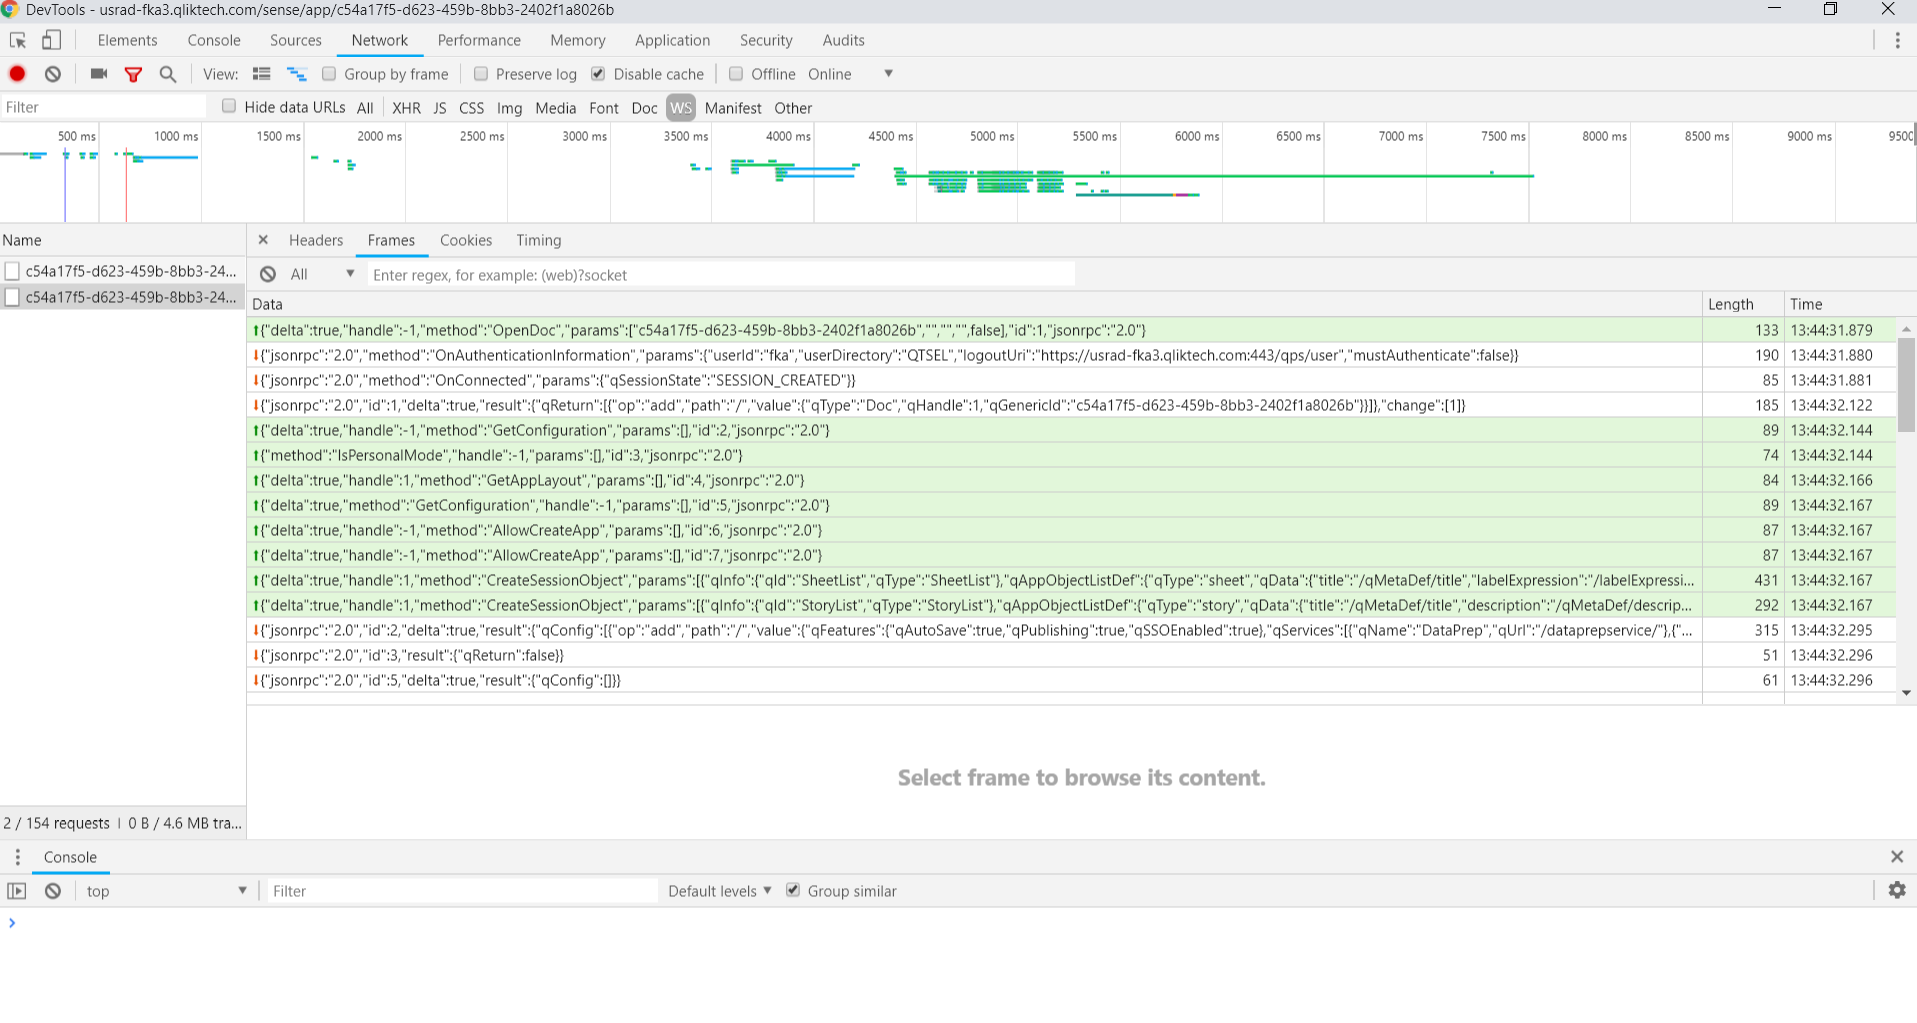
Before you get started checking out websocket traffic from Qlik Sense, you must know how to use browser dev tools to inspect websocket traffic. Open a tab in Chrome and open the dev tools for that tab, then navigate to a Qlik Sense app or mashup. Now in dev tools, go to the network tab, and filter for WS. You should see the websocket listed, select it. Now notice the tabs for headers, frames, cookies, and timing. You can inspect request and response headers in the headers tab, see cookies sent with the request in the cookies tab, and check out the load time in the timing tab. But the frames tab is where the action is. Click on that and you can see all of the messages sent and received over the websocket.
WHAT TO LOOK FOR WITH QLIK SENSE WEBSOCKET TRAFFIC
All the communication with the Qlik Sense engine happens over the websocket. You can see the messages for authenticating and connecting, opening a doc, creating and fetching objects, getting layouts, and more. You’ll want to match messages sent, which are highlighted in green, with its response message. Both will have the same id.
Here’s an incomplete list of good uses for checking out the websocket communication:
CHECKING THE STATUS OF THE CONNECTION
The first two frames should always be the responses for authentication and connection. In the authentication response, you can see the user id and directory, the logout uri, and whether authentication is required or not. In the connection response, you can see that the connection was successful and whether a new session was created, or a session was attached to an existing session. If the session was attached, that means its sharing the session with another existing session. This is what you would want to check if you were opening up two or more websocket connections to the same app and wanted to make sure the connections were going to share the same session. You can also see the messages sent and received when opening a doc, which can sometimes be useful debugging any issues.
DEBUGGING
This one’s kind of obvious but should be mentioned. Here’s an example. If you’re trying to embed objects and they’re not showing up on the page, you should inspect the websocket communication. You can check to make sure that a connection is made, the doc has been opened successfully, and the getObject message has been sent. Then you can check the response message to see if it tells you anything about your issue. If you try to get an object but have the wrong id, for instance, you’ll see that you don’t get an error for anything, but the response just doesn’t contain an object, which is a good indication that you just requested an object that doesn’t exist.
LEARNING STUFF
I like to check out the websocket communication for native Qlik Sense objects. This let’s me see how native objects do things like paginate the data on scroll, or use the beginSelections and endSelections methods, so I can get ideas for replicating similar functionality in my own custom visualizations.
-
Table Functions
Today, I am going to blog about Table functions. I came across these functions when I was exploring the various ways I can determine if a table exist... Show MoreToday, I am going to blog about Table functions. I came across these functions when I was exploring the various ways I can determine if a table exists in the data model. The table functions I will review today include:
- FieldName
- FieldNumber
- NoOfFields
- NoOfRows
- NoOfTables
- TableName
- TableNumber
These functions provide information about the current table being loaded or specified in the function. All of these functions should be used in the script but the NoOfRows function can also be used in a chart expression. Let’s take a closer look at these functions but first let’s load a table that we can work with.
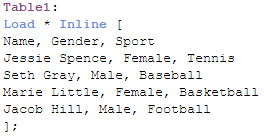
Now load the script to illustrate the functions:
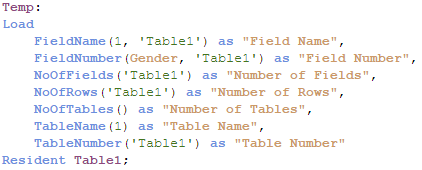
Here are the results of the Temp table loaded above:

While the function names give you a good idea on what they are used for, let’s take a more detailed look at each one of them.
FieldName
The FieldName function takes two parameters, field number and table name, and returns the name of the respective field. Based on the script above, the FieldName function will return Name since it is field 1 in the Table1 table. Note, field numbers start with 1, not 0.
FieldNumber
The FieldNumber function takes two parameters, field name and table name, and returns the number of the specified field in the table. In this case, Gender has a field number of 2 in Table1 so 2 is returned by the FieldNumber function.
NoOfFields
The NoOfFields function takes one parameter, table name, and returns the number of fields in the table that was specified. The table name parameter must be for a table that is already loaded in the data model. It cannot be for the table that is currently being loaded. For example, in the script above, the table Temp could not be used in the NoOfFields function since that is the table being loaded.
NoOfRows
The NoOfRows function also takes one parameter, table name, and returns the number of rows in the specified table. Like the NoOfFields function, this function must be used for a table that was previously loaded.
NoOfTables
The NoOfTables function does not take any parameters and returns the number of tables that have previously been loaded in the data model. Based on the script above, the NoOfTables function will return 1 for the Table1 table. Note that it does not include the Temp table that is being loaded when this function executes.
TableName
The TableName function takes one parameter, table number, and returns the name of the table with the respective table number.
TableNumber
The TableNumber function takes one parameter, table name, and returns the number of the table with the respective table name. Note that the table number starts with 0 and not 1 so TableNumber(Table1) will return 0 since Table1 was the first table loaded.
Hopefully, you have learned something new and found this useful. Table functions provide information about the tables and fields that have been loaded in the data model. If you would like more information, check out the Qlik Help site.
Thanks,
Jennell
-
Qlik Community Update - August 2018
Hey Guys,Watch this video to learn what's happening at Qlik. In the video I cover:Qlik and Podium Data: http://qlik.com/podiumdataTrusted Extension De... Show MoreHey Guys,
Watch this video to learn what's happening at Qlik.
In the video I cover:
- Qlik and Podium Data: http://qlik.com/podiumdata
- Trusted Extension Developer Program
- Qlik Launches Dual Use Offer!
- Qlik Sense June 2018 Highlights
- Qlik Sense Cloud Updates
- https://vizlib.com/ - Vizlib
- https://www.climber.eu/ - Climber
Qlik Community Update
Can't see the video? YouTube blocked by your region or organization? Download the attached .mp4 to watch on your computer or mobile device.
Regards,
Qlik
-
A professors journey with Qlik
We are excited to share with you a story about professor Dominic Soh who works at Macquarie University in Australia. Dominic joined the program in 20... Show More
We are excited to share with you a story about professor Dominic Soh who works at Macquarie University in Australia. Dominic joined the program in 2016 and has been incorporating Qlik Sense into his classrooms ever since. Year over year, hundreds of his students sign up for the program to get access to all of the amazing, FREE resources the program offers. These resources allow Dominic to easily update his curriculum and incorporate Qlik into his assignments. To learn more about Dominic's story, read the snapshot attached.
-
Dimension Colors
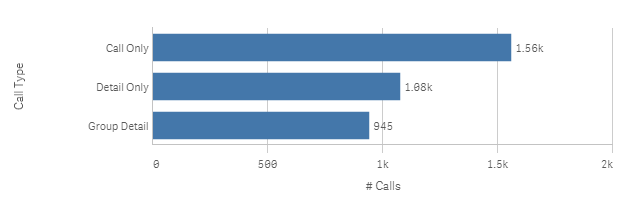
A few months ago, I wrote a blog about setting colors in master dimensions and measures. Today I am going to share a little more about how master dim... Show MoreA few months ago, I wrote a blog about setting colors in master dimensions and measures. Today I am going to share a little more about how master dimensions can be set to a single color or multiple colors. Let’s first talk about setting a dimension to a single color. This can be helpful when you want to use a color other than the Qlik Sense default color in your charts. For instance, a bar chart may look like this with the default blue color.
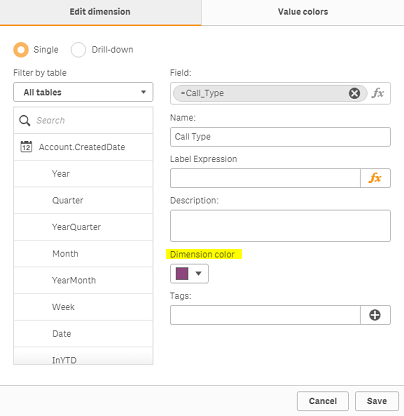
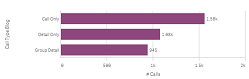
But if your app is using a different color theme, you may want all the bars to be purple for instance. You can do this by setting the Dimension color on the Edit dimension tab of the master dimension to the color you would like the dimension to be. This color will be the same for all dimension values which is good practice when there are many dimension values.
Now let's discuss setting a master dimension to multiple colors. Sometimes you may need the color for each dimension value to be different. This is when you can use the Value colors tab of the master dimension to set the colors of each dimension value. The stacked bar chart below is a good example of when you may want the dimension values to have different colors. This chart is looking at the calls by activity type and call type. The call type dimension values are set to 3 different shades of blue so that they can be distinguished in the stacked bar chart. If the color values were not set, then the standard blue, red and yellow colors would be used instead.
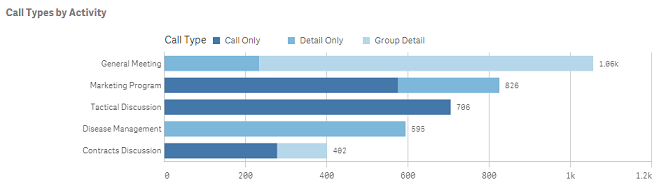
The color values can be set on the Value colors tab of the master dimension (see image below). A color scheme can be used to set the colors or each value can be set manually. The call type field only has 3 values so it is a good candidate for value colors. You want to avoid using values colors or coloring by dimension if there are several different dimension values. Too many different colors (or not so different colors) can become confusing and indistinguishable to the user.
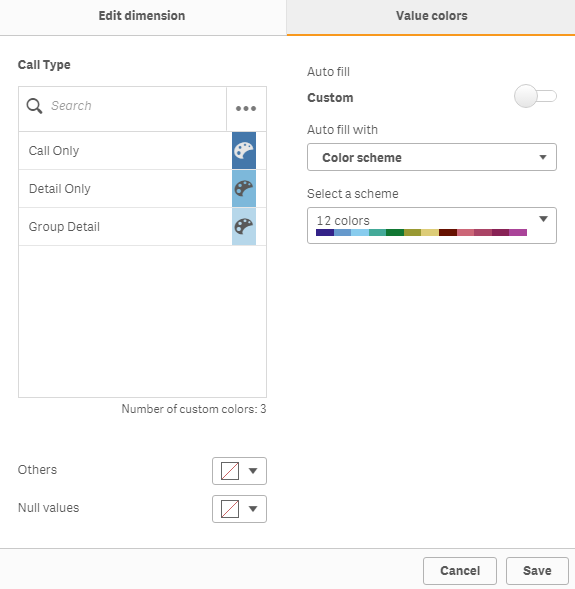
On the Value colors tab, there is also the option to select a color for Others, if you are adding any limitations to the dimension, or for Null values. When using the value colors to color your dimensions, be sure to select color by dimension and enable library color in the properties of the chart. Check out this video in Qlik Sense Help for more information.
These color features available in dimension master items provide one place to set and edit the dimension colors used in charts. You can set it once and use it in multiple charts. This promotes consistency in our apps thus making them easier to digest and understand.
Thanks,
Jennell
-
Error Variables
Today I am going to blog about Error Variables and how they can be used in an app. Error variables are available in Qlik Sense and QlikView to: Deter... Show MoreToday I am going to blog about Error Variables and how they can be used in an app. Error variables are available in Qlik Sense and QlikView to:
- Determine what actions should be taken if an error occurs during script execution
- Provide information about error(s) that occur during script execution
The four error variables I will review in this blog are:
- ErrorMode
- ScriptError
- ScriptErrorCount
- ScriptErrorList
Of the 4 error variables, ErrorMode is the only variable that is set by the user. This variable determines what should happen if an error occurs during script execution. This variable is set in the script like this:

ErrorMode can take one of three values: 0, 1 or 2. By default, ErrorMode is set to 1. This means that if there is an error during script execution, the script will stop and prompt the user for an action. When ErrorMode is set to 0, the error will be ignored and the script execution will continue. When ErrorMode is set to 2, the script will fail and stop. The ErrorMode variable should be set at the beginning of the script or before a section of the script where you know there may be errors that you would like to handle. Once the ErrorMode is set, it will remain the same unless the ErrorMode variable is reset/changed later in the script. For instance, you may opt to set the ErrorMode variable to 0 if there is an area in your script that may throw errors that you would like to ignore (not stop script execution). In this case, you may need to set ErrorMode back to 1 if you want to be notified of other errors later in the script.
Let’s see how the error messages are presented if I run the simple script below to load a group of Excel files that start with “Book.” Note, that all the files loaded do not include the “Monthly Sales” field.
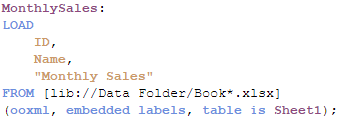
If I precede this script with Set ErrorMode = 0, this is what I see when the script is complete.
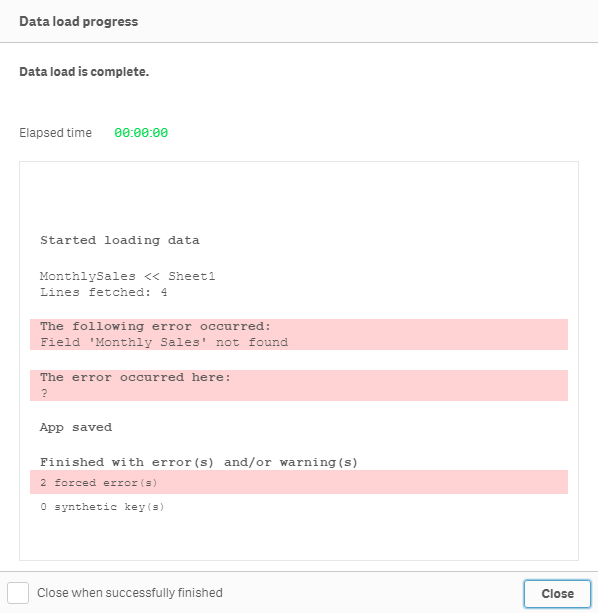
Notice that the script finished executing even though there was an error. Now let’s see what happens if we keep the default (ErrorMode = 1) or set ErrorMode = 2.
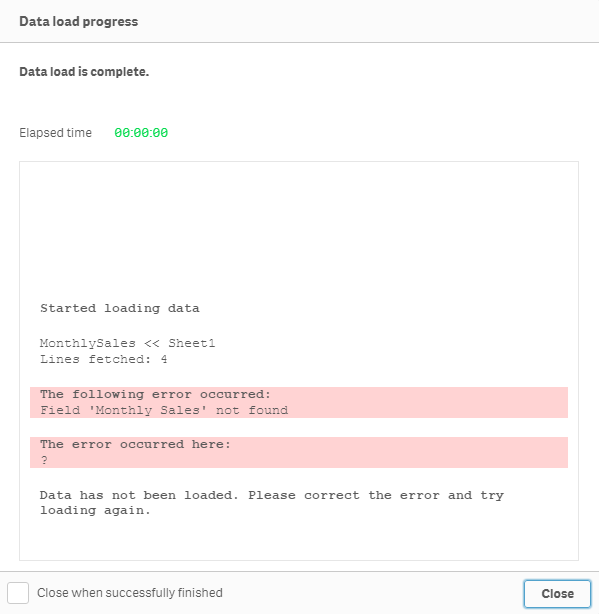
Here the script execution stopped at the error and did not complete providing the option to Close, correct the script and reload again.
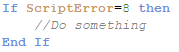
Unlike the ErrorMode variable, the ScriptError, ScriptErrorCount and ScriptErrorList variables are output from Qlik Sense or QlikView that provide information about the error that was encountered when the script was executing. The ScriptError variable will return an error code. A list of the error codes and their descriptions can be found here in Qlik Sense Help. ScriptErrorCount returns the number of statements that caused an error during script execution. Lastly, the ScriptErrorList variable returns a list of the errors encountered during script execution. If there is more than one error, they are separated by a line feed. These error variables can be accessed in the script or via the UI. In the script, you can simply refer to the ScriptError variable to find its’ value. For example, in the script below, I can check for the error code 8 (“File not found”) to determine if the file being loaded was missing.
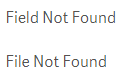
Error variables can also be access in the UI via the Text & image object. In the Text & image object measure, simply enter an equal sign and the name of the variable like this:
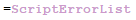
To return something like this:
Error variables are useful and easy to use. I find ErrorMode = 0 the one I use the most when I know there is a chance that the script may throw an error that is ok to ignore. It is also useful if you need to control the path of the script’s execution based on an error. You can learn more about error variables in Qlik Sense Help.
Thanks,
Jennell
-
Qlik supports education on all levels!
Learn how Qlik within education can do more than improve students analytical skill sets! Visit https://searchbusinessanalytics.techtarget.com/feature... Show More
Learn how Qlik within education can do more than improve students analytical skill sets! Visit https://searchbusinessanalytics.techtarget.com/feature/Predictive-analytics-in-education-can-flag-troubled-students to read the amazing story of how one school used Qlik to determine what students were at risk academically and what the school did to turn them around!
If you are a university professor or student, visit The Qlik Academic Program to learn more about how you can get access to free software, training, the Qualification exam and more!
-
Qlik supports education on all levels!
Learn how Qlik within education can do more than improve students analytical skill sets! Visit https://searchbusinessanalytics.techtarget.com/feature... Show More
Learn how Qlik within education can do more than improve students analytical skill sets! Visit https://searchbusinessanalytics.techtarget.com/feature/Predictive-analytics-in-education-can-flag-troubled-students to read the amazing story of how one school used Qlik to determine what students were at risk academically and what the school did to turn them around!
Professors- Not only can Qlik impact your students but it has the power to improve the university on an organizational level! If there are any teams within you're university that you think can benefit from Qlik, please reach out to us to begin a conversation.
-
Starter project for developing QAP-powered apps with React and enigma.js
I've been doing most of my projects lately with React and enigma.js, and developing some general patterns along the way that I've been working into a ... Show MoreI've been doing most of my projects lately with React and enigma.js, and developing some general patterns along the way that I've been working into a starter project that I can use as a starting point. I'd like to share that with you today, and potentially start a discussion around the design decisions I've made thus far.
The starter project can be found at GitHub - fkabinoff/qlik-react-starter: Starter project for rapidly developing QAP-powered apps. It's still very much in development, but there's a decent framework and dev environment in place, as well as a few useful components.
Overview
The project uses enigma.js to interface with the Qlik engine, along with React, webpack, Babel, ESLint, Sass, and a few other goodies. Really, a pretty standard React app with enigma.js added. The qDoc, which is the name the enigma.js docs use for the connection to the Qlik app is created in a plain Javascript module and simply imported to any file that needs to use it.
I use react-hot-loader, which allows you to change react components without refreshing the page or losing state, and I really like it. It has it's problems, most noticeably to me that it doesn't play very nicely with higher order components, but the ability to change my React components and not have to reload the page or lose state helps me develop faster.
I'm using the latest Babel preset, which enables es2015, es2016, and es2017, and Babel plugins which enable decorators, spread syntax, and class properties. I can't believe we actually wrote Javascript before this stuff.
I use the very popular airbnb config for ESLint. It helps keep the code healthy and uniform.
I make use of reactstrap, a library of Bootstrap 4 components for React, and SASS for customizing and mixing in Bootstrap styles, as well as creating a few utility classes. I prefer using reactstrap over some of the more feature-rich React UI libraries, because I often find it creates more work trying to make the components of those UI libraries, such as Material UI, play nicely with how I want a component in a Qlik-powered app to function since in a Qlik-powered app the Qlik engine acts as a state machine, and many of the UI libraries with more features expect the state to be managed and changed by the client. Reactstrap gives me what I need, without being too opinionated about it.
I use the "render prop" pattern in place of higher order components. The render prop pattern is simply passing a component as a prop to another component for that component to render it. It basically works like a higher order component does, but to me it's a bit simpler, a little more flexible, and doesn't mess with react-hot-reload or PropTypes checking.
Notably, I don't use a state manager like Redux or MobX, and this may be my most contentious decision. To me, the use of a state manager in most instances is redundant when building a Qlik-powered app. Qlik already manages my state, and shares it between components. I hardly, if ever, have state that needs to be managed outside of Qlik in my Qlik-powered apps, and using a state manager forces me to do extra work to keep the client state and Qlik state in sync. I don't like it.
It would be very interesting to hear what you think about these design decisions, and the decisions that you've made with your own Qlik projects.
Components
Now, let's take a look at the actual components. There are currently 4 Qlik-specific components, but I expect to add more as I continue developing this. I tried to design the Qlik-specific components to expect props which are identical to values defined in Qlik docs, and pass down values directly returned by the Qlik engine, in order to standardize as much as possible. Though in some instances, I broke that rule. For instance, since the QlikObject wrapper, which I'll talk about in a moment, is really only designed to work with an object that fetches one page, it didnt make sense to pass down the qDataPages returned by the Qlik generic object getData method. Instead, I simply pass down the object at the first index of qDataPages.
QlikObject.jsx
The QlikObject component implements the render prop pattern, and contains the logic to create and manage a Qlik generic object and its state. It passes down the Qlik generic object information to the component defined in the Component prop, which is responsible for rendering something.
QlikVirtualScroll.jsx
The QlikVirtualScroll component implements the render prop pattern, and paginates data on vertical scroll so only data in view gets rendered. It passes down a subet of the qMatrix to the component defined in the Component prop, which is responsible for rendering something. It is used by the QlikFilter and QlikTable components.
QlikFilter.jsx
The QlikFilter component renders a dropdown that acts as a Qlik Sense filter. It's meant to be used as the `Component` prop of a `QlikObject` component a type of `qListObject`. This component doesn't need to be passed any props other than the props passed to it by `QlikObject`.
QlikTable.jsx
The QlikTable component renders a table. It's meant to be used as the `Component` prop of a `QlikObject` component with a type of `qHyperCube`. This component requires a prop `columnWidths` to be passed to it, defining the widths of the columns of the table. This prop should be passed using the `componentProps` prop of the `QlikObject`.
Finishing up
Go to GitHub - fkabinoff/qlik-react-starter: Starter project for rapidly developing QAP-powered apps, download the zip, run npm install, and npm run dev, and you can check out the QlikFilter and QlikTable components in action, and check out the code. I'll be adding more components and styles as I'm still pretty actively developing it, so watch the repo if you're interested, and let me know what you think.
-
Addressing issues with Qlik Sense chart tooltips in mashups
If you're creating a mashup that includes embedded Qlik Sense charts, there's a couple issues you may run into that you'll want to be aware of. First,... Show MoreIf you're creating a mashup that includes embedded Qlik Sense charts, there's a couple issues you may run into that you'll want to be aware of.
First, if your mashup scrolls, and you scroll down the page, you will notice that the tooltips on the Qlik Sense charts are not positioned correctly, like below:
The tooltips will get more and more displaced the further down the page you scroll. For the tooltips to be positioned correctly, you'll have to adjust how scrolling happens on your page a little bit.
The easiest option that you can implement with just some CSS is to set the html and body tags to a height of 100%, hide the overflow on the html tag, and add use overflow: auto on the body tag. That looks like this:
html, body {
height: 100%;
overflow: hidden;
}
body {
overflow: auto;
}
Now the tooltips will no longer be displaced when you scroll your mashup. However, there are times when it may be necessary to watch the scroll position of the page, or be able to set the scroll position of the page programmatically, and for some reason, when using the above method the scrollTop attribute of the body tag never actually updates, so there is no way to observe when the page scrolls or set the scroll position programmatically.
In instances like this, just a simple extra step will fix the issue. What you'll need to do is add a wrapper element that wraps the entire content of your mashup, and also set that to a height of 100%, and put the overflow on that element. That element's scrollTop will be set correctly, and you can observe or set it programmatically. So, it would be something like this:
<head>
<style>
html, body, #page-content {
height: 100%;
overflow: hidden;
}
#page-content {
overflow: auto;
}
</style>
</head>
<body>
<div id="page-content">
<!-- All of your content -->
</div>
</body>
The other issue you may run into is the chart tooltip not be styled correctly, since it may be affected by the CSS in your mashup. The most common example I see of this is if using Bootstrap v4. Bootstrap v4 adds some negative margins to the .row class, and the tooltip also uses the row class, and it makes the text in the tooltip get cut off, like this:
To fix this, and any other styling issues you may have with the tooltips, it's helpful to be able to inspect it. A div with the class .qs-chart-tooltip will be appended near the end of the body. If you inspect the page and find that element, then expand it, it's first child element is a div that has display: none set, just uncheck that style and you'll be able to view the tooltip in it's last location. Then you can continue to expand those child elements and inspect the element, looking for any issues. In the case I show above, as I stated, the problem is with Bootstrap v4 and it's negative margins on the .row class. So the css below fixed the tooltip:
.qv-chart-tooltip-inner .row {
margin-left: 0;
margin-right: 0;
}
So, now you should be able to address these Qlik Sense chart tooltip issues I often see in mashups. If you have any questions, let me know!
-
Data Reduction Using Multiple Fields
Last week I wrote about authorization using Section Access and data reduction. In the example, a user was associated with a country and this entry poi... Show MoreLast week I wrote about authorization using Section Access and data reduction. In the example, a user was associated with a country and this entry point in the data model determined whether a record was visible or not: Only records associated with the country were visible. COUNTRY was the reducing field.
But if you want several reducing fields? You may have a user that should see one product group in one country, and another product group in another country. Then both COUNTRY and PRODUCTGROUP should be reducing fields. Is that possible?
Yes and No.
Yes, it is possible. But No, you cannot just add a second reducing field. In simple cases, just adding a second reducing field will work fine, but as soon as the logic is slightly more complex, it will not work. Below I’ll explain why.
Let’s use the following example: A user MARKUS should see the product group Machines in Germany and Food in France – but not the other way around. Then the obvious approach would be to create an authorization table like the following:
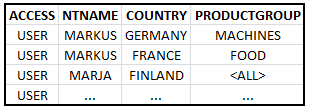
I.e. two reducing fields – COUNTRY and PRODUCTGROUP – defining the following logic:
(‘GERMANY‘ AND ‘MACHINES’) OR (‘FRANCE’ AND ‘FOOD’)
However, this will not work in QlikView.
If you do the above, you will get a data model like the following (where the red table is the Section Access table).
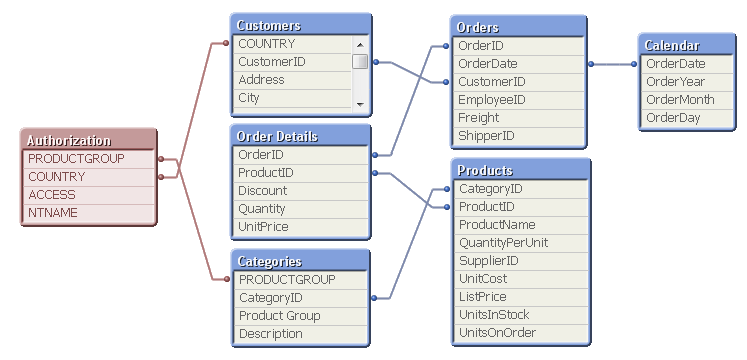
This means that the selections in the real data model will be made in COUNTRY and in PRODUCTGROUP. But remember that QlikView always uses OR-logic between values of the same field and AND-logic between fields. This means that QlikView will interpret the selection in these two fields as
(‘GERMANY‘ OR ‘FRANCE’) AND (‘MACHINES’ OR ‘FOOD’)
which is not the same as the initial requirement. The selection made will include Machines in France and Food in Germany, which is against the initial requirement. In fact, it is impossible to make a selection that corresponds to the initial requirement using only these two fields.
So what should you do?
The solution is to create a new, single reducing field based on COUNTRY and PRODUCTGROUP, e.g. through
COUNTRY & ‘|’ & PRODUCTGROUP as AUTHORIZATIONKEY
The first challenge is to find the table where this key should be created. It must be in a table with a grain fine enough that both country and product group are uniquely defined on each record. In the above data model this is the Order Details table: Each order line has only one product and one customer – thus one product group and one country – associated with it. So, the authorization key should be created here.
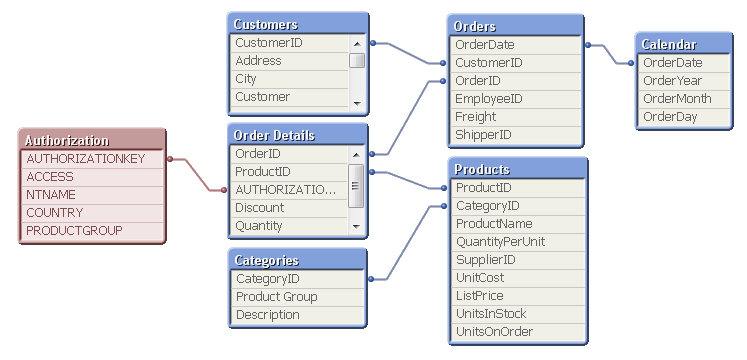
There are other challenges also, e.g. how to get the country and product group information into the load of the Order Details table (Solution: ApplyMap) and how to handle the concept of Any Value (Solution: Generic Keys), but these can all be solved. For details, see the blog post about Complex Authorization.
Bottom line: You can use multiple reducing fields in Section Access, but only if each user has only one record in the authorization table. If a user has several records, you need to create one single authorization key.
Also, the above example clearly shows that authorization is part of the data modelling and should be thought of at an early stage in the development process.
Further reading related to this topic:

-
Enabling analytics-ready data - the latest addition to Qlik
Part of Qlik’s strategy in supplying enterprise customers with an end-to-end analytics strategy is to deliver a more comprehensive portfolio that help... Show MorePart of Qlik’s strategy in supplying enterprise customers with an end-to-end analytics strategy is to deliver a more comprehensive portfolio that helps address one of our customers’ biggest challenges – the data itself. In support of this mission, Qlik recently acquired Podium Data, an enterprise-grade data management company whose solution simplifies and accelerates the customers’ ability to manage, prepare and deliver data to every business user across a diverse data landscape. With the addition of Podium Data, Qlik now has the ability to deliver an unparalleled enterprise data management solution – capable of transforming raw data into a governed and “analytics-ready” information resource for QlikView and Qlik Sense.
This is exciting news for Qlik customers. The Podium platform can optimize and leverage existing data within an organization, as the technology develops a comprehensive understanding of data sources, and then curates, enriches & transforms all data into business-ready information. It provides a complete data hub offering with key capabilities, such as:
- Intelligent Data Profiling and Onboarding
- Automated Data Quality
- Data Preparation and Publishing
- Smart Data Catalog
With the addition of Podium Data, Qlik is now able to directly address a set of common data challenges that exist within many organizations and will enable our customers to be data-driven organizations.
We are thrilled to have Dr. Paul Barth, Founder and CEO of Podium Data, on Qlik’s Management Team. As a highly respected and recognized thought-leader on business driven data strategies and best practices, his recent article on CIO.com “Migrating data to the cloud: Back to the future” supports Qlik’s vision of enabling companies to be data-driven organizations. Endless insights with control and confidence in data is now possible…
To learn more about Qlik’s expanded data management capabilities and the value it will bring to our customers, go to the new Podium Data Product page on Qlik.com and join us for a webinar later this month to learn more about the Podium platform. Register here
-
Search functionality with Qlik Sense Engine API
There are 5 methods on the doc class to help you search in various ways. They are the SearchAssociations, SearchObjects, SearchResults, SearchSuggest,... Show MoreThere are 5 methods on the doc class to help you search in various ways. They are the SearchAssociations, SearchObjects, SearchResults, SearchSuggest, and SelectAssociations methods. I’ll touch on all of them in more detail except the SearchObjects method, which is a bit out of scope for this post. Just know that you can search through the objects in a Qlik Sense app with this method.
Each of the rest of the methods all take a qOptions parameter, which is a SearchCombinationOptions object. This object has a qSearchFields property which is an array of fields to search. It defaults to all fields. This object also has a qContext property, which takes one of three possible values including “Cleared”, “LockedFieldsOnly”, and “CurrentSelections”. “Cleared” clears all selections in the app before searching, “LockedFieldsOnly” respects selections in locked fields, and “CurrentSelections” respects all selections. One other property worth mentioning on the SearchCombinationOptions object is the qAttributes property. This can be used with the SearchResults method to request more details about the results. Check out the documentation for further details.
SearchAssociations
This method is deprecated, use SearchResults instead.
SearchResults
https://help.qlik.com/en-US/sense-developer/June2018/apis/EngineAPI/services-Doc-SearchResults.html
The SearchResults method is useful for display search results similar to how they are displayed in the Qlik Sense client. It takes 3 parameters, an options object, an array of search terms, and the page of results you want to retrieve. The results are returned as an array of objects with information on the search term matched, the field name, the items in the field that were matched, and the ranges in the items of the match. All of this information is useful when displaying search results to the user. If you want to allow the user to select results, you can request the results to contain qElemNumbers by correctly setting the qAttributes property of the qOptions object, but the easiest thing to do is to use the SelectAssociations method.
SearchSuggest
https://help.qlik.com/en-US/sense-developer/June2018/apis/EngineAPI/services-Doc-SearchSuggest.html
The SearchSugest method is useful for displaying search suggestions to the user as they search. You can see this kind of functionality in action in the Qlik Sense client or on the Qlik Sense Branch site when you use the search feature and see suggestions pop up as grayed text in the search bar, as well as below the search bar in the dark colored suggestion bar. This method takes 2 parameters, an options object, and an array of search terms. It’s common to use this in conjunction with SearchResults and SelectAssociations to display suggestions.
SelectAssociations
The SelectAssociations method is used for selecting search results. It takes 3 parameters, an options object, an array of search terms, and the index of the search result to select. The most obvious use case for this method is to use it to select results from the SearchResults method. You can display the results of the SearchResults method, and then allow the user to select a result, and call the SelectAssociations method with the same options object and array of search terms as the original SearchResults method call, passing the index of the search result the user clicked. This will select all values in that field that match the search.
Another less obvious use of SelectAssociations is to use it as a “live search,” making selections as the user searches, like the Qlik Sense Branch page. The trick is, you only want to have to search and select in one field, otherwise you would have to loop through results and make selections that could potentially exclude each other. So first you’d have to create a field which contained the values of all the fields you wanted to include in the search, with a key to associate the rows of this field back to the rows of the originating fields. Then you could use the SelectAssociations to search just that field and select the first index of results as the user types in a search bar.
SearchListObjectFor
Unlike the other methods I’ve discussed so far, the SearchListObjectFor method is a method on the GenericObject class, and applies to list objects only. This method takes 2 parameters, a qPath parameter which is the path to the list object, and a qMatch parameter which is the search string. This method provides functionality similar to what you see in filter objects in the Qlik Sense client. The way it works is when you call the SearchListObjectFor method on a list object, it reduces the data in that list object, without affecting the rest of the app. If you want to accept the search and select the values in the list object, you use another function, the AcceptListObjectSearch method.
Using SearchListObjectFor on a list object as opposed to using the search methods on the doc class is useful for creating typeaheads, where all possible search results are displayed when the use clicks the search bar, and are reduced as the user searches, or in custom filter objects.
If you guys have any questions about these methods, or using search with Qlik Sense, let me know. Also, checkout this great library on Qlik Branch for searching. http://branch.qlik.com/#!/project/56af9cc5126a633074bea476


