Unlock a world of possibilities! Login now and discover the exclusive benefits awaiting you.
- Qlik Community
- :
- Forums
- :
- Analytics & AI
- :
- Products & Topics
- :
- Visualization and Usability
- :
- Re: Alternate Dimensions in Pivot or Simple Table
- Subscribe to RSS Feed
- Mark Topic as New
- Mark Topic as Read
- Float this Topic for Current User
- Bookmark
- Subscribe
- Mute
- Printer Friendly Page
- Mark as New
- Bookmark
- Subscribe
- Mute
- Subscribe to RSS Feed
- Permalink
- Report Inappropriate Content
Alternate Dimensions in Pivot or Simple Table
Hi Everyone,
I am trying to find a way to add alternative dimensions in a pivot table or a simple table, the same way we have in bar, line chart etc. What I am looking for is a dropdown list with all the dimensions in it. When I click on a particular dimension, the dimension part of the table must get replaced accordingly and the data should change as per the dimension applied. Please let me know how I can achieve this?
Best Regards,
Rony
- « Previous Replies
- Next Replies »
- Mark as New
- Bookmark
- Subscribe
- Mute
- Subscribe to RSS Feed
- Permalink
- Report Inappropriate Content
No change happens to the table in the master visualization even after dropping it to the climber extension, as shown in the image above.
- Mark as New
- Bookmark
- Subscribe
- Mute
- Subscribe to RSS Feed
- Permalink
- Report Inappropriate Content
Did you choose Replace instead of Add? You should choose to Add the table.
talk is cheap, supply exceeds demand
- Mark as New
- Bookmark
- Subscribe
- Mute
- Subscribe to RSS Feed
- Permalink
- Report Inappropriate Content
This is the only option I am getting. The table in the master visualization can be any table right?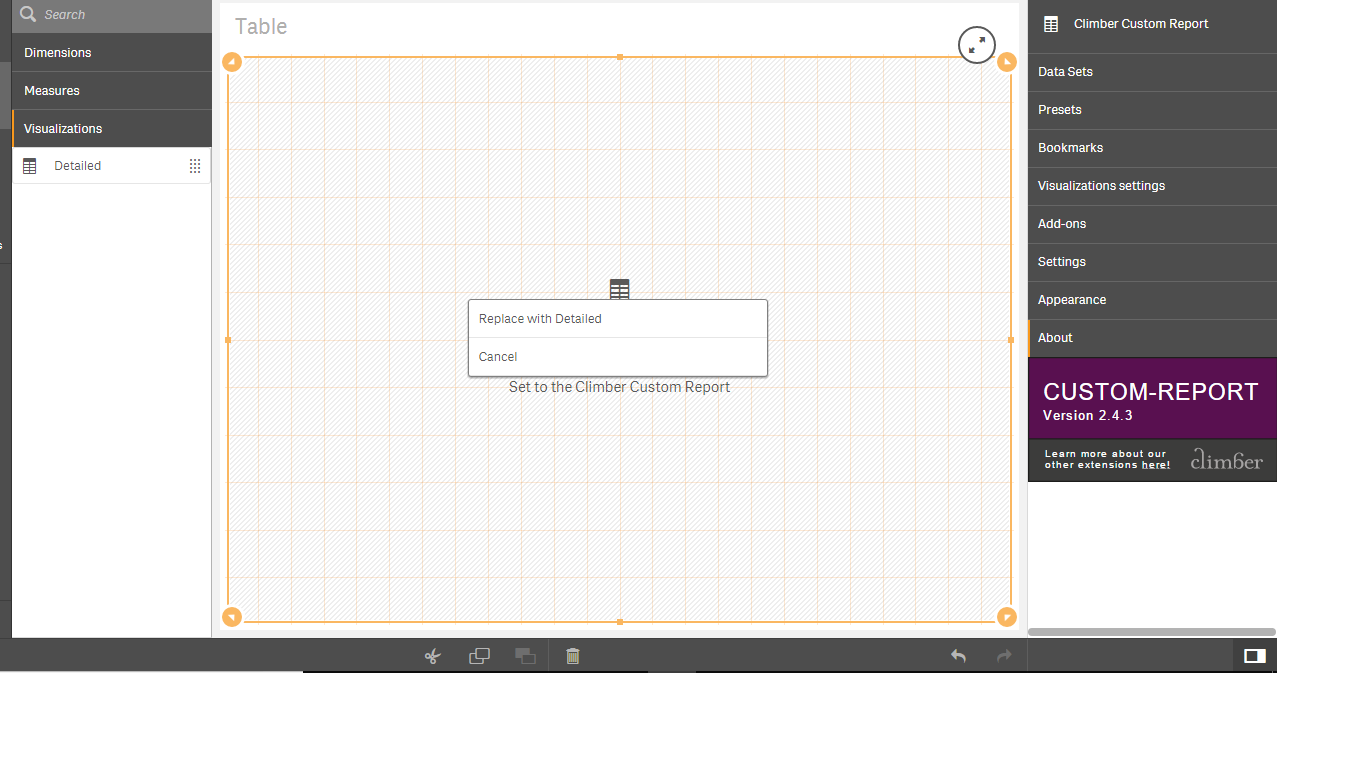
- Mark as New
- Bookmark
- Subscribe
- Mute
- Subscribe to RSS Feed
- Permalink
- Report Inappropriate Content
Which version of Qlik Sense are you using?
talk is cheap, supply exceeds demand
- Mark as New
- Bookmark
- Subscribe
- Mute
- Subscribe to RSS Feed
- Permalink
- Report Inappropriate Content
Hi Gysbert,
The master visualization that I created was using a vizlib table. I just tried the same using a simple table available by default in qlik sense and it seems to be working now. Looks like it does not read an extension table.
I am using June 2018 QS.
Rony
- Mark as New
- Bookmark
- Subscribe
- Mute
- Subscribe to RSS Feed
- Permalink
- Report Inappropriate Content
Makes sense. Glad you got it sorted.
talk is cheap, supply exceeds demand
- Mark as New
- Bookmark
- Subscribe
- Mute
- Subscribe to RSS Feed
- Permalink
- Report Inappropriate Content
It is working fine now. Thanks for your help Gysbert.
Regards,
Rony
- Mark as New
- Bookmark
- Subscribe
- Mute
- Subscribe to RSS Feed
- Permalink
- Report Inappropriate Content
Hi Ron
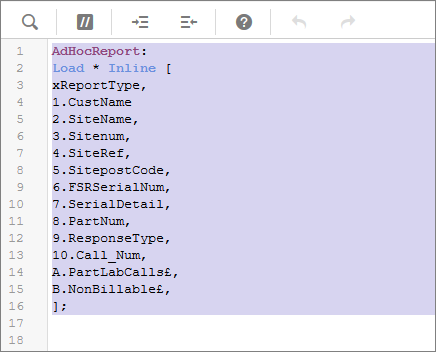
Step 1. Step up list in script as follows
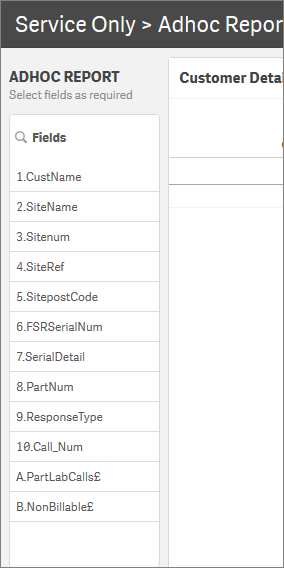
Step 2. Set up a filter pane and table (Pivot table)in a sheet
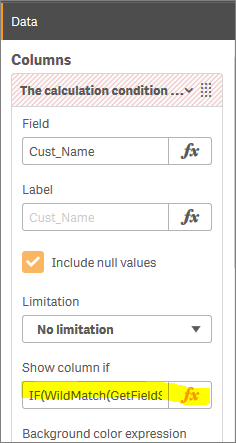
Step three. Add columns > dimension or measures to table or pivot table
Step 4. Link the dimension or measures to the filter pane
IF(WildMatch(GetFieldSelections(xReportType),'*CustName*'),1,0)
- Mark as New
- Bookmark
- Subscribe
- Mute
- Subscribe to RSS Feed
- Permalink
- Report Inappropriate Content
Hi Robert,
Thank you for the detailed explanation. I will try this.
Best Regards,
Rony
- « Previous Replies
- Next Replies »