Unlock a world of possibilities! Login now and discover the exclusive benefits awaiting you.
- Qlik Community
- :
- Forums
- :
- Analytics & AI
- :
- Products & Topics
- :
- Visualization and Usability
- :
- Calculating Time Series Growth %
- Subscribe to RSS Feed
- Mark Topic as New
- Mark Topic as Read
- Float this Topic for Current User
- Bookmark
- Subscribe
- Mute
- Printer Friendly Page
- Mark as New
- Bookmark
- Subscribe
- Mute
- Subscribe to RSS Feed
- Permalink
- Report Inappropriate Content
Calculating Time Series Growth %
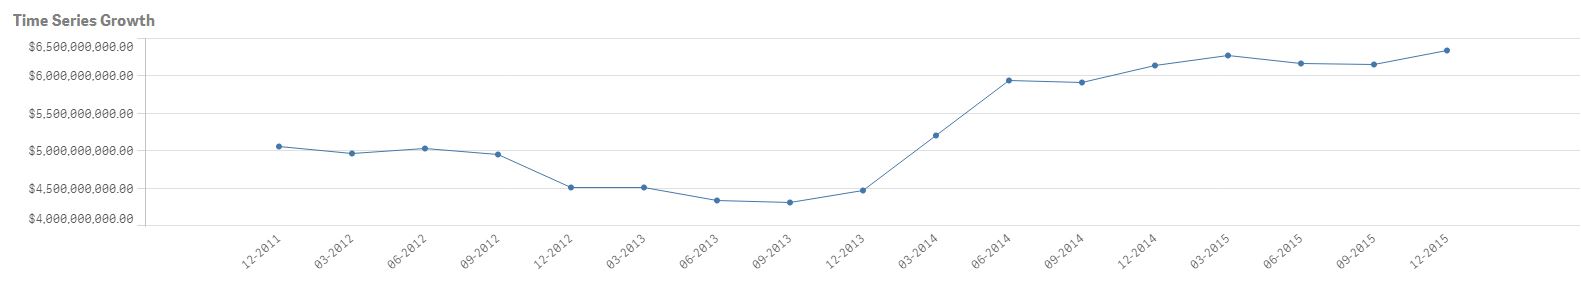
I am trying to calculate QoQ growth % of sales through time and plot it in a manner similar to the chart below. I'm not sure if there is a way to do this through set analysis (all of my attempts have failed). I am able to calculate QoQ growth but only one period at a time
(sum({$<[Time Period]={"12-2015"}>}[Sales])-sum({$<[Time Period]={"09-2015"}>}[Sales]))/(sum({$<[Time Period]={"09-2015"}>}[Sales]))
.I've also tried Not sure if it matters but each time period has ~2000 entries. Is there anyway to do this? Any help would be appreciated! Thanks in advance!
Accepted Solutions
- Mark as New
- Bookmark
- Subscribe
- Mute
- Subscribe to RSS Feed
- Permalink
- Report Inappropriate Content
Try something like this:
=(Sum(Sales) - Above(Sum(Sales)))/Above(Sum(Sales))
- Mark as New
- Bookmark
- Subscribe
- Mute
- Subscribe to RSS Feed
- Permalink
- Report Inappropriate Content
Try something like this:
=(Sum(Sales) - Above(Sum(Sales)))/Above(Sum(Sales))
- Mark as New
- Bookmark
- Subscribe
- Mute
- Subscribe to RSS Feed
- Permalink
- Report Inappropriate Content
May be as attached:

- Mark as New
- Bookmark
- Subscribe
- Mute
- Subscribe to RSS Feed
- Permalink
- Report Inappropriate Content
Much simpler than I thought. Thank you!