Unlock a world of possibilities! Login now and discover the exclusive benefits awaiting you.
- Qlik Community
- :
- Forums
- :
- Analytics & AI
- :
- Products & Topics
- :
- Visualization and Usability
- :
- Calculating sales growth
- Subscribe to RSS Feed
- Mark Topic as New
- Mark Topic as Read
- Float this Topic for Current User
- Bookmark
- Subscribe
- Mute
- Printer Friendly Page
- Mark as New
- Bookmark
- Subscribe
- Mute
- Subscribe to RSS Feed
- Permalink
- Report Inappropriate Content
Calculating sales growth
Hi Everyone,
I want to calculate semester on semester sales growth(2017S2-2017S1) as well as YoY sales growth(2017S2-2016S2).
NOTE: I want to make it dynamic i.e. if the data updates to 2018S1 sales the code should automatically consider the added semester as the latest one and give the sales growth accordingly.
I cannot figure out any logic for it. Please guide me towards the desired output.
Attached is a sample data. Thanks.
Best Regards,
- « Previous Replies
-
- 1
- 2
- Next Replies »
Accepted Solutions
- Mark as New
- Bookmark
- Subscribe
- Mute
- Subscribe to RSS Feed
- Permalink
- Report Inappropriate Content
The column is created in script, not in the excel file, i havent change it, just transformed the Semester field you have there to two fields (Semester Number and Year) for easier handling of data and set analysis expression.
The raw data stays the same. The input i've inserted was the same as yours:
| Name | Semester | Sales |
| Karan | 2018S1 | 16 |
| Rahul | 2018S2 | 1 |
This is what I added, i didnt do the Year or Semester number on the file, see the attached xlsx file.
Final user wont even know that the Year column is being created in the UI (front-end) unless it creates a new chart / dimension / measure.
- Mark as New
- Bookmark
- Subscribe
- Mute
- Subscribe to RSS Feed
- Permalink
- Report Inappropriate Content
Hi Raul,
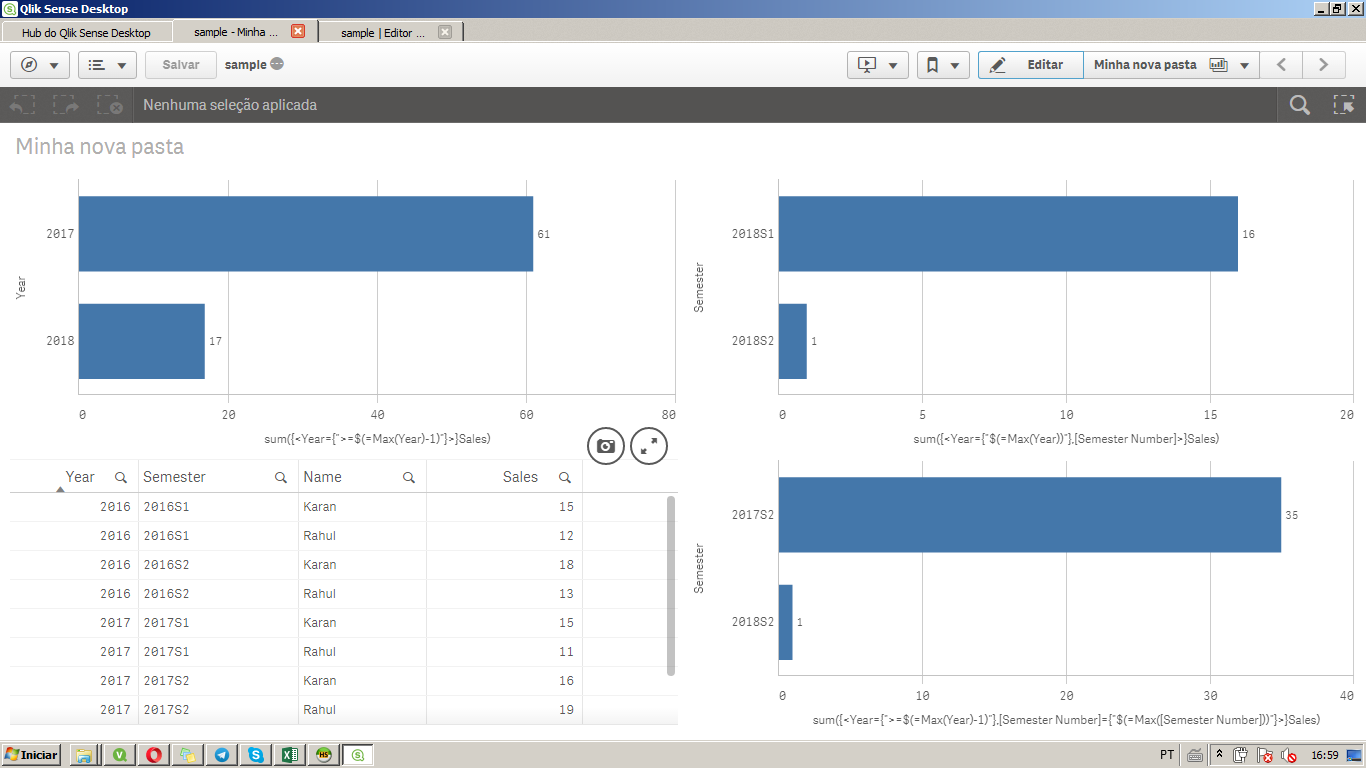
Made a quick example with what you need.
Hope it helps.
- Mark as New
- Bookmark
- Subscribe
- Mute
- Subscribe to RSS Feed
- Permalink
- Report Inappropriate Content
Hi Felip,
Sorry I wasn't able to open it. Actually, I am looking for a qliksense solution and I think you have provided a qlikview file. Can you provide it for Qlik Sense.? Thanks.
Best Regards,
- Mark as New
- Bookmark
- Subscribe
- Mute
- Subscribe to RSS Feed
- Permalink
- Report Inappropriate Content
Hi Rahul, my mistake.
Attached the QVF file
- Mark as New
- Bookmark
- Subscribe
- Mute
- Subscribe to RSS Feed
- Permalink
- Report Inappropriate Content
Your solution is correct but I have to make it more dynamic in case the time period changes from Semester level to rolling 6 months that is to be refreshed every month.
- Mark as New
- Bookmark
- Subscribe
- Mute
- Subscribe to RSS Feed
- Permalink
- Report Inappropriate Content
If your semester or year changes, the Max(Year) Max(Semester) will automatically change the expressions on the charts, what else do you need as changing?
Added two rows to the excel file
| Karan | 2018S1 | 16 |
| Rahul | 2018S2 | 1 |
And got the attached file
- Mark as New
- Bookmark
- Subscribe
- Mute
- Subscribe to RSS Feed
- Permalink
- Report Inappropriate Content
In my input the semester will remain a string. I cannot change the input every time I refresh the data. You have changed the input(if I am not wrong) to split the semester into to separate columns which I am afraid won't work for me. Is there any other alternative?
- Mark as New
- Bookmark
- Subscribe
- Mute
- Subscribe to RSS Feed
- Permalink
- Report Inappropriate Content
Understood it now.
I've made some changes and the semester is still a string, but i would advise to keep the numerical parts, as its easier to treat in set analysis as a number rather than a string,
- Mark as New
- Bookmark
- Subscribe
- Mute
- Subscribe to RSS Feed
- Permalink
- Report Inappropriate Content
Hi Felip, I see that you are still using the created column, 'Year'. This is not solving the purpose. Let me put it this way, I want to create a dashboard in such a manner that it gives the sales growth every month. All the person needs to do is to input the raw data. The person whom I am handing this over to wont be able to create the column, 'Year'.
Can we still try and find any other alternative?
- Mark as New
- Bookmark
- Subscribe
- Mute
- Subscribe to RSS Feed
- Permalink
- Report Inappropriate Content
The column is created in script, not in the excel file, i havent change it, just transformed the Semester field you have there to two fields (Semester Number and Year) for easier handling of data and set analysis expression.
The raw data stays the same. The input i've inserted was the same as yours:
| Name | Semester | Sales |
| Karan | 2018S1 | 16 |
| Rahul | 2018S2 | 1 |
This is what I added, i didnt do the Year or Semester number on the file, see the attached xlsx file.
Final user wont even know that the Year column is being created in the UI (front-end) unless it creates a new chart / dimension / measure.
- « Previous Replies
-
- 1
- 2
- Next Replies »