Unlock a world of possibilities! Login now and discover the exclusive benefits awaiting you.
- Qlik Community
- :
- Forums
- :
- Analytics & AI
- :
- Products & Topics
- :
- Visualization and Usability
- :
- Color By Expression
- Subscribe to RSS Feed
- Mark Topic as New
- Mark Topic as Read
- Float this Topic for Current User
- Bookmark
- Subscribe
- Mute
- Printer Friendly Page
- Mark as New
- Bookmark
- Subscribe
- Mute
- Subscribe to RSS Feed
- Permalink
- Report Inappropriate Content
Color By Expression
Hi All,
I have a data modell like this:
direction values here: in or out
amount: values here numbers
date: values here ... 
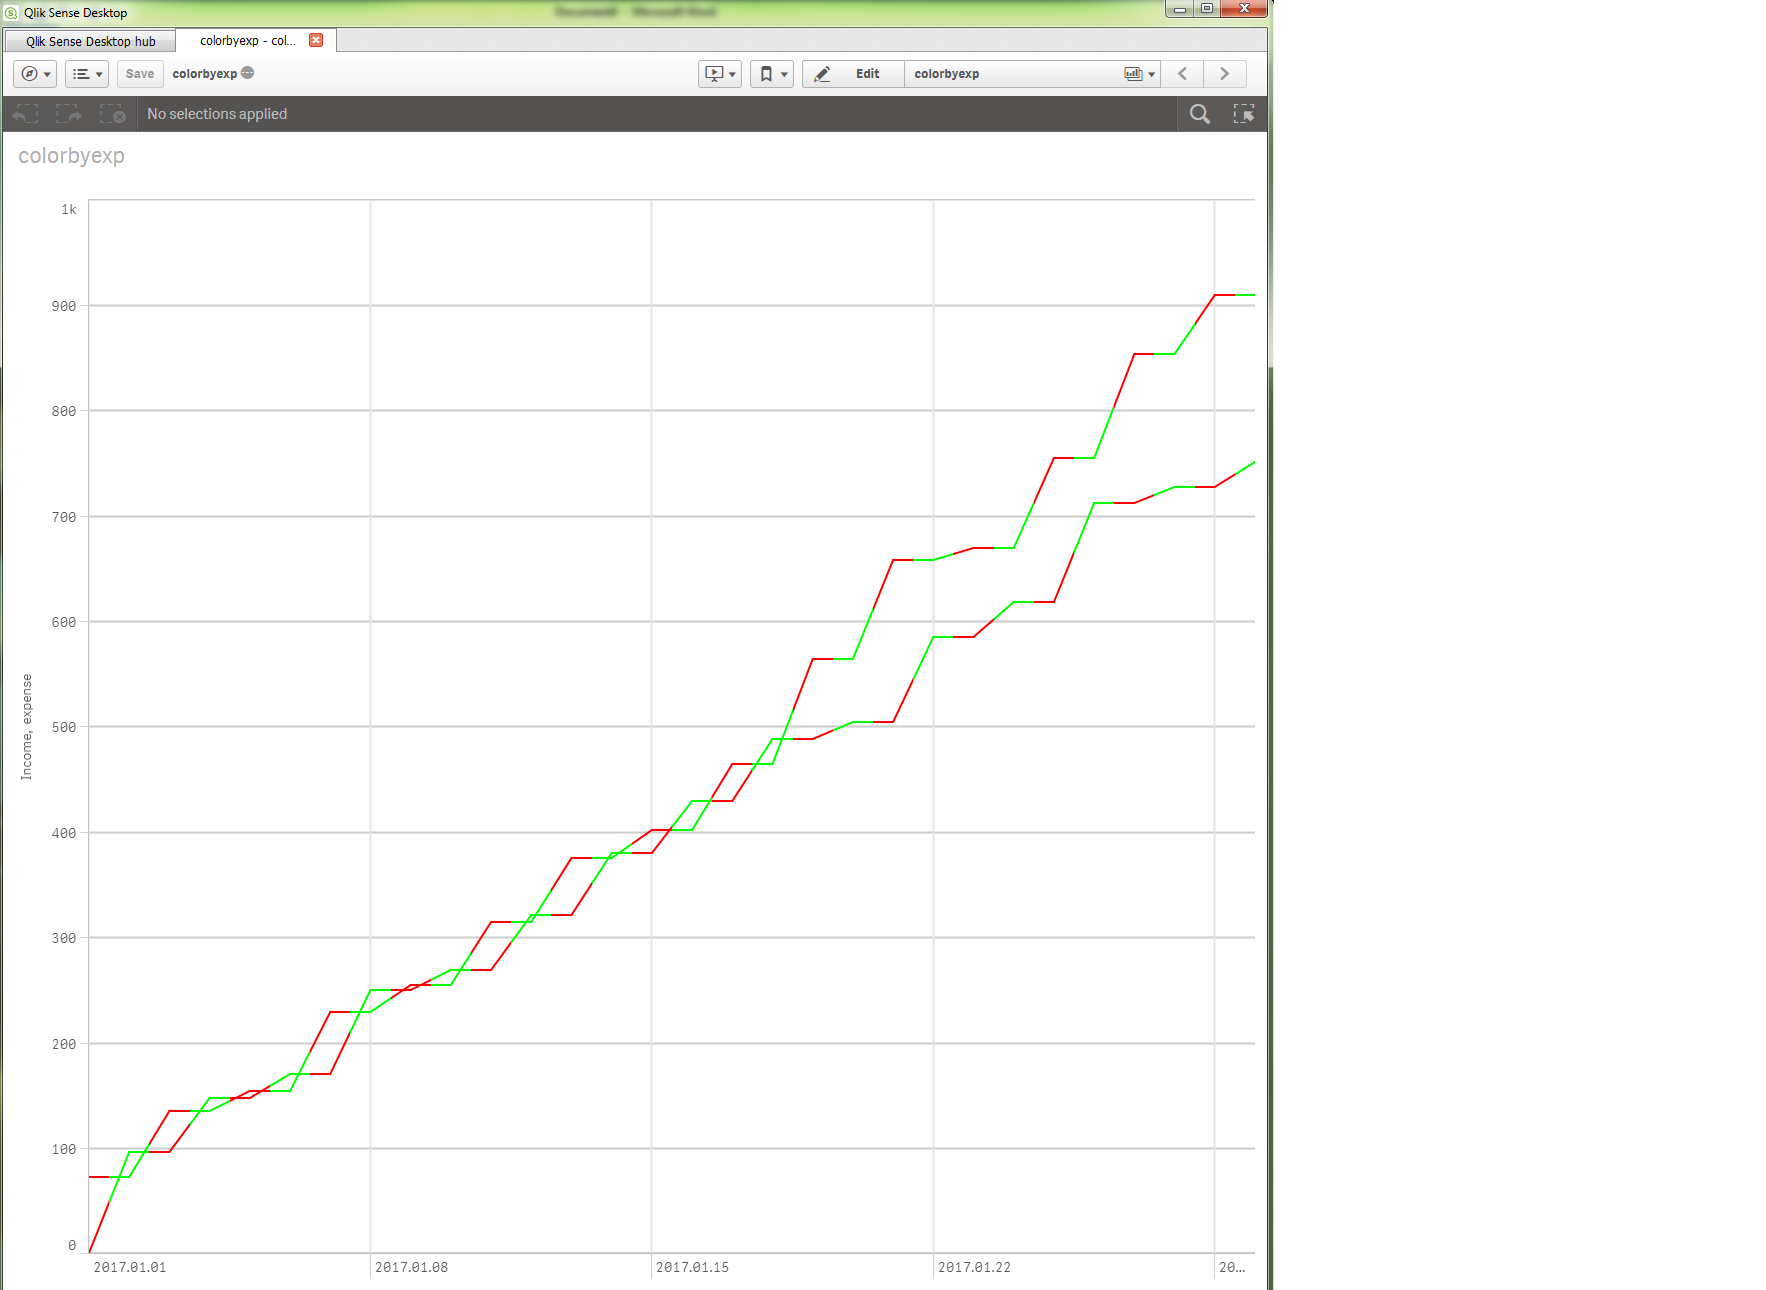
I would like to make an accumulated line chart (succeeded) which represents the incomes and expenses, and colored the two line with an expression (not succeeded).
Dimension: date
Measures:
RangeSum(Above(Sum({<direction={'in'}>}amount),0,RowNo())) and
RangeSum(Above(Sum({<direction={'out'}>}amount),0,RowNo()))
Coloring:
Color and legend / Colors by expression: if(direction='in',lightred(),lightgreen()).
Please help me how can I set up the colors with expression for the lines.
qvf, pic and data are attached.
Thanks,
Daniel