Unlock a world of possibilities! Login now and discover the exclusive benefits awaiting you.
- Qlik Community
- :
- Forums
- :
- Analytics & AI
- :
- Products & Topics
- :
- Visualization and Usability
- :
- Creating a calculated field for grouped attributes
- Subscribe to RSS Feed
- Mark Topic as New
- Mark Topic as Read
- Float this Topic for Current User
- Bookmark
- Subscribe
- Mute
- Printer Friendly Page
- Mark as New
- Bookmark
- Subscribe
- Mute
- Subscribe to RSS Feed
- Permalink
- Report Inappropriate Content
Creating a calculated field for grouped attributes
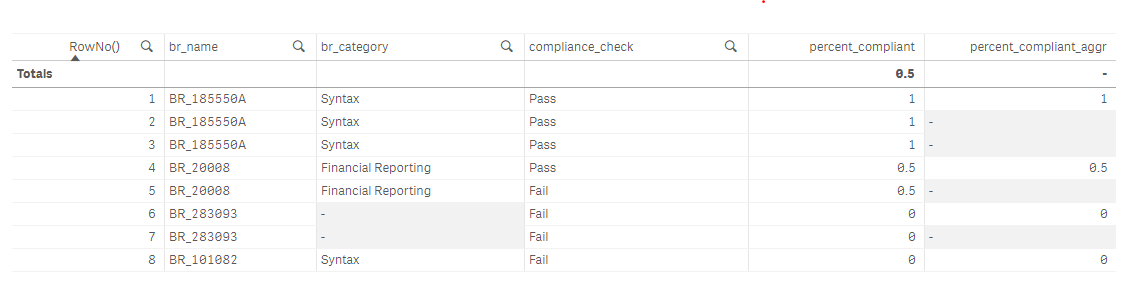
For the given table (attached):

TLDR: I'm trying to get the average percent compliant grouped by br_name and br_category.
So doing a pivot table works, but I won't be able to get a bar chart off of a pivot table which is why I'm trying to create the percent_compliant field using a set expression
- Mark as New
- Bookmark
- Subscribe
- Mute
- Subscribe to RSS Feed
- Permalink
- Report Inappropriate Content
Did you try adding the following in your total expressions?
, br_category
Here is a really good write up on total with aggr.
https://community.qlik.com/t5/Qlik-Design-Blog/Totals-in-Charts/ba-p/1464797
- Mark as New
- Bookmark
- Subscribe
- Mute
- Subscribe to RSS Feed
- Permalink
- Report Inappropriate Content
You may even be able to go a little simpler. Give this a try?
Aggr(
Count({<compliance_check={'Pass'}>}br_name)
/
count(total<br_name, br_category> br_name)
,br_name)