Unlock a world of possibilities! Login now and discover the exclusive benefits awaiting you.
- Qlik Community
- :
- Forums
- :
- Analytics & AI
- :
- Products & Topics
- :
- Visualization and Usability
- :
- Custom Colors
- Subscribe to RSS Feed
- Mark Topic as New
- Mark Topic as Read
- Float this Topic for Current User
- Bookmark
- Subscribe
- Mute
- Printer Friendly Page
- Mark as New
- Bookmark
- Subscribe
- Mute
- Subscribe to RSS Feed
- Permalink
- Report Inappropriate Content
Custom Colors
HI all,
jgd
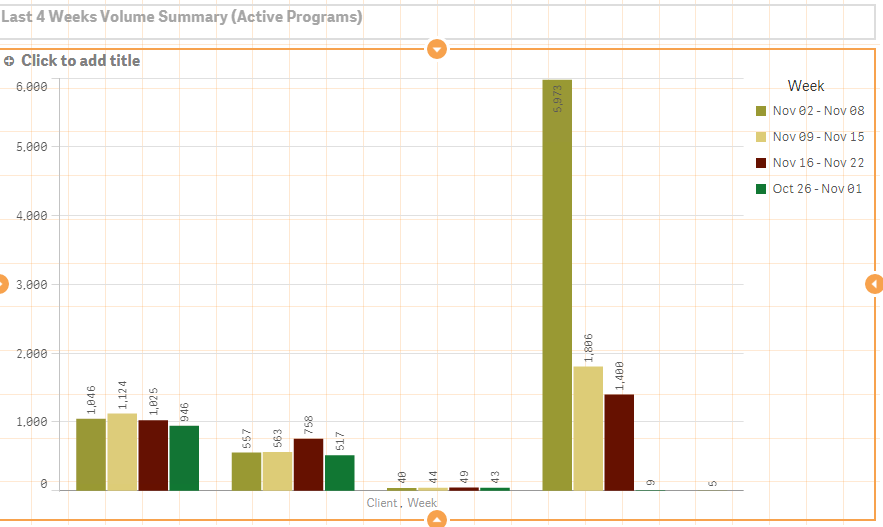
I am using below Measures and dimensions. I am finding difficulty in writing expression for custom color please help on it,
Dimension:
1. If(Match(client_id, '15','12','13','19','6'),client_id)
2. Week_group
Measure:
count({<weekstart={">=$(=date(max(weekstart)-35))<$(=date(max(weekstart)-7))"},DateType={'invitation'},
client_id = {'15','12','13','19','6'}>}invitation_id)
I need a custom color for bars which representing the counts of last 4 weeks for the client_id's.
Regards,
Kumar
- Tags:
- custom color
- « Previous Replies
-
- 1
- 2
- Next Replies »
- Mark as New
- Bookmark
- Subscribe
- Mute
- Subscribe to RSS Feed
- Permalink
- Report Inappropriate Content
i asked to know if any possibilities is there?
- Mark as New
- Bookmark
- Subscribe
- Mute
- Subscribe to RSS Feed
- Permalink
- Report Inappropriate Content
Hi Pramod,
I don't think you have understood what I have said. You cannot hide one label. You have an option to hide or display the Labels / Titles, but not the individual labels of the dimensions.
PS: Hiding one of the labels of the dimensions is not possible.
As an alternative, if you need to do it very badly, just hide both the labels and use an extension to build one for your self.
Example code:
var xAxis = d3.svg.axis()
.scale( x )
.tickValues([10, 20, 30, 40, 80, 90, 100]);// or add any other labels you need
Hope this answers your question.
- « Previous Replies
-
- 1
- 2
- Next Replies »