Unlock a world of possibilities! Login now and discover the exclusive benefits awaiting you.
- Qlik Community
- :
- Forums
- :
- Analytics & AI
- :
- Products & Topics
- :
- Visualization and Usability
- :
- Re: Display Value and Percentage in Pie Chart
- Subscribe to RSS Feed
- Mark Topic as New
- Mark Topic as Read
- Float this Topic for Current User
- Bookmark
- Subscribe
- Mute
- Printer Friendly Page
- Mark as New
- Bookmark
- Subscribe
- Mute
- Subscribe to RSS Feed
- Permalink
- Report Inappropriate Content
Display Value and Percentage in Pie Chart
Qlik Sense provides the option of displaying a value or percentage in a pie chart. How do I display both?
Presentation:
Value labels: Custom->Values
Value labels: Auto->Percentage
Thanks for your help.
- Tags:
- pie chart %
- « Previous Replies
-
- 1
- 2
- Next Replies »
- Mark as New
- Bookmark
- Subscribe
- Mute
- Subscribe to RSS Feed
- Permalink
- Report Inappropriate Content
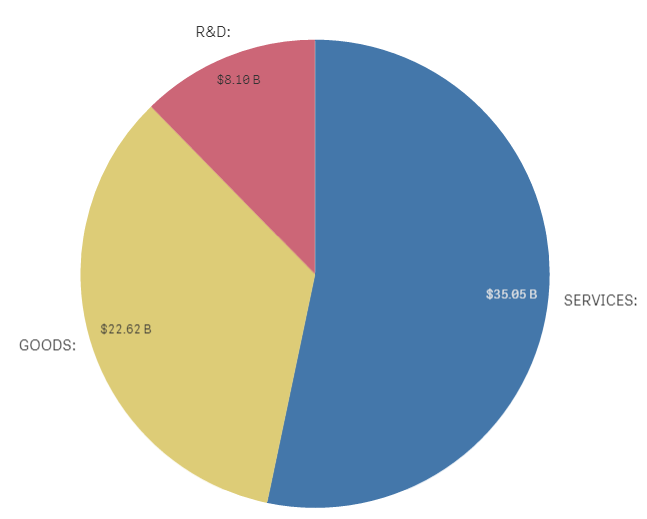
sure:
in u pie chart;
as dimension:
=YourDim&' : '& aggr(num(sum(YourMeasure)/sum(total{<YourDim>} YourMeasure),'#,##0.00%'),YourDim)
as a measure:
sum(YourMeasure)
Under aspect > presentation, show the values:

result (per aalogy): 
- Mark as New
- Bookmark
- Subscribe
- Mute
- Subscribe to RSS Feed
- Permalink
- Report Inappropriate Content
Omar - Thank you for your assistance. Would you mind sending the qvf file for the above?
- Mark as New
- Bookmark
- Subscribe
- Mute
- Subscribe to RSS Feed
- Permalink
- Report Inappropriate Content
I can't; it's a qvf containing all of my answers in the community..
ps:Why is ur response helpful and not mine? 
- Mark as New
- Bookmark
- Subscribe
- Mute
- Subscribe to RSS Feed
- Permalink
- Report Inappropriate Content
My mistake Omar. I meant to mark yours as helpful. Thanks again.
- Mark as New
- Bookmark
- Subscribe
- Mute
- Subscribe to RSS Feed
- Permalink
- Report Inappropriate Content
Just kidding 
- Mark as New
- Bookmark
- Subscribe
- Mute
- Subscribe to RSS Feed
- Permalink
- Report Inappropriate Content
Omar,
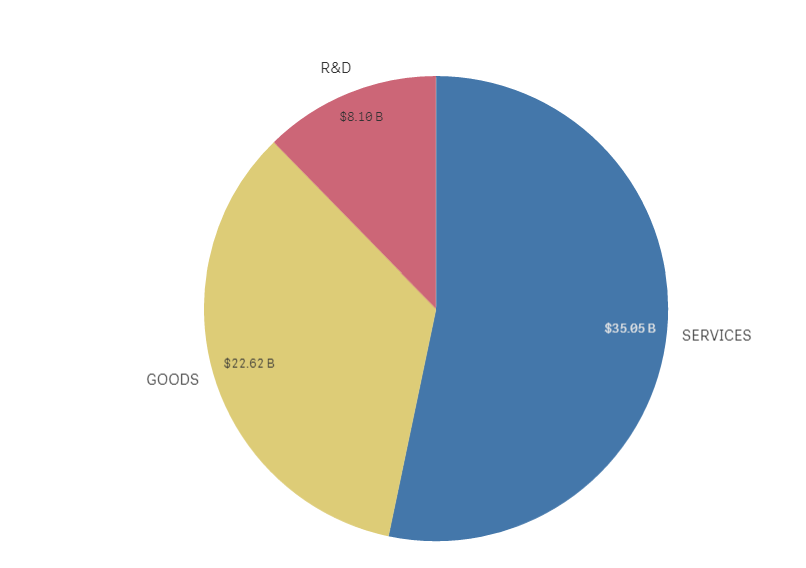
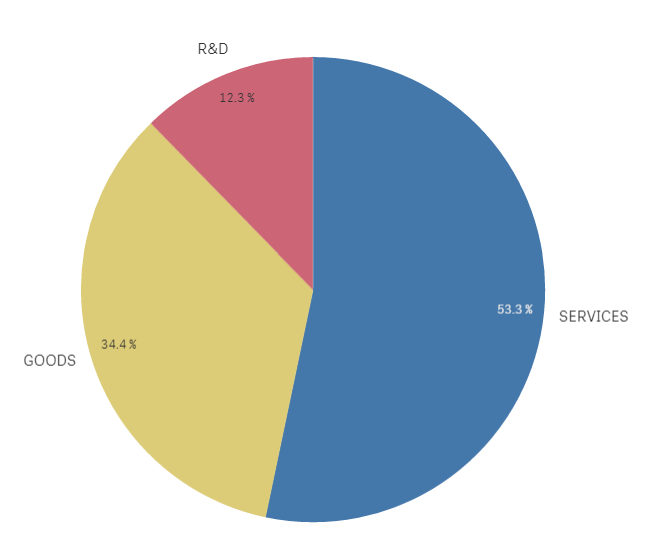
My original Dim = [G-R&D-S]
My original Measure = Sum({<[Funding Agency ID]={5700}>}[Action Obligation])/1000000000
I changed the Dim to:
=[G-R&D-S] & ':' & AGGR(NUM(Sum([Action Obligation])/Sum(TOTAL{[G-R&D-S]}[Action Obligation]),'#,##0.00%'), [G-R&D-S])
But it gives:
Any ideas? It is grammatically correct but does not produce what I was looking for. Thanks
- Mark as New
- Bookmark
- Subscribe
- Mute
- Subscribe to RSS Feed
- Permalink
- Report Inappropriate Content
I think it may be like this -
=[G-R&D-S] & ':' & AGGR(NUM(Sum([Action Obligation])/Sum(TOTAL<[G-R&D-S]> Action Obligation]),'#,##0.00%'), [G-R&D-S])
- Mark as New
- Bookmark
- Subscribe
- Mute
- Subscribe to RSS Feed
- Permalink
- Report Inappropriate Content
Hey Omar This is awesome. can we do something similar for bar chart on qlik sense. Instead of %s to show on x-axis , can we show them as number(%) on bar itself. I tried using dual fucntion, its no use. and there are discussions where you can show values next to legend on charts in qlik view. I assume its not something we can do it in sense.
any similar tips /tricks to work with bar chart ?
- Mark as New
- Bookmark
- Subscribe
- Mute
- Subscribe to RSS Feed
- Permalink
- Report Inappropriate Content
Very helpful. Thanks!
- « Previous Replies
-
- 1
- 2
- Next Replies »