Unlock a world of possibilities! Login now and discover the exclusive benefits awaiting you.
- Qlik Community
- :
- Forums
- :
- Analytics & AI
- :
- Products & Topics
- :
- Visualization and Usability
- :
- Force show all zero values for 2nd dimension in ba...
- Subscribe to RSS Feed
- Mark Topic as New
- Mark Topic as Read
- Float this Topic for Current User
- Bookmark
- Subscribe
- Mute
- Printer Friendly Page
- Mark as New
- Bookmark
- Subscribe
- Mute
- Subscribe to RSS Feed
- Permalink
- Report Inappropriate Content
Force show all zero values for 2nd dimension in bar chart x-axis
Hi,
I want to add a dummy Application name ("AppX") to force show all ageing months regardless of filter selection. How can I go about (using set analysis?) to always display all months? Or is there any other way I can accomplish this? 
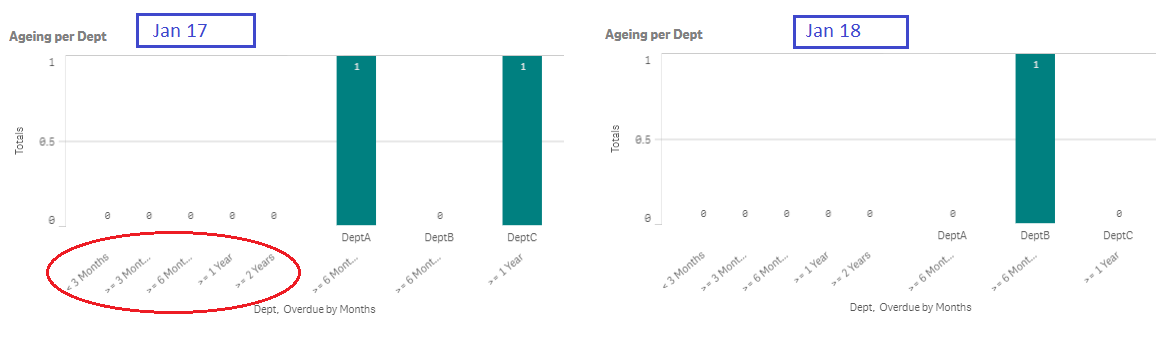
Basically I want to be able to display all zeroes; i.e. circled in red - for all Departments.
I have managed to force show all Depts by adding + Avg({1} 0) to my Measure. Not sure if info is useful but my bar chart displays the latest month by default as follows:
if(isnull(Count({$<[PT.Month]={'$(=Max([PT.Month]))'}, [PT.isOverdue]={'Yes'}>}
([App-Issue]))), 0,
Count({$<[PT.Month]={'$(=Max([PT.Month]))'}, [PT.isOverdue]={'Yes'}>}
([App-Issue]))) + Avg({1} 0)
Attached is the testing load script.
Screenshots for reference
For Jan 17: Dept A and C has values for >=6 Months and >=1 Year
For Jan 18: Dept B has values for >=6 Months
- Tags:
- bar chart
- qlik sense
- Mark as New
- Bookmark
- Subscribe
- Mute
- Subscribe to RSS Feed
- Permalink
- Report Inappropriate Content
Hi,
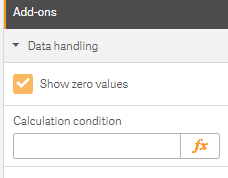
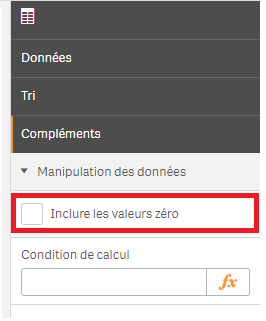
did you try cheking "display null values" under complements ?
- Mark as New
- Bookmark
- Subscribe
- Mute
- Subscribe to RSS Feed
- Permalink
- Report Inappropriate Content
Hi,
It is checked already