Unlock a world of possibilities! Login now and discover the exclusive benefits awaiting you.
Announcements
Talend Cloud AWS EU Scheduled Outage: Starting Tues 26 May 21:00 CEST with expected completion Wed 27 May 01:00 CEST
- Qlik Community
- :
- Forums
- :
- Analytics & AI
- :
- Products & Topics
- :
- Visualization and Usability
- :
- Graph with X and Y axis in different tables
Options
- Subscribe to RSS Feed
- Mark Topic as New
- Mark Topic as Read
- Float this Topic for Current User
- Bookmark
- Subscribe
- Mute
- Printer Friendly Page
Turn on suggestions
Auto-suggest helps you quickly narrow down your search results by suggesting possible matches as you type.
Showing results for
Contributor III
2018-01-05
05:54 PM
- Mark as New
- Bookmark
- Subscribe
- Mute
- Subscribe to RSS Feed
- Permalink
- Report Inappropriate Content
Graph with X and Y axis in different tables
Hello,
I am new to qlik and need your help please!
I have 2 tables as follow:
| Month |
|---|
JAN |
| FEB |
| MAR |
| AVR |
| MAY |
And the other table is as follow
| ITEMS | IN | OUT |
|---|---|---|
| ITEM 1 | JAN | MAY |
| ITEM 2 | FEV | FEV |
| ITEM 4 | FEV | MAR |
| ITEM 5 | FEV | MAR |
| ITEM 6 | MAR | MAY |
| ITEM 7 | MAR | APR |
| ITEM 8 | MAR | MAR |
| ITEM 9 | MAR | MAY |
| ITEM 10 | APR | |
| ITEM 11 | APR |
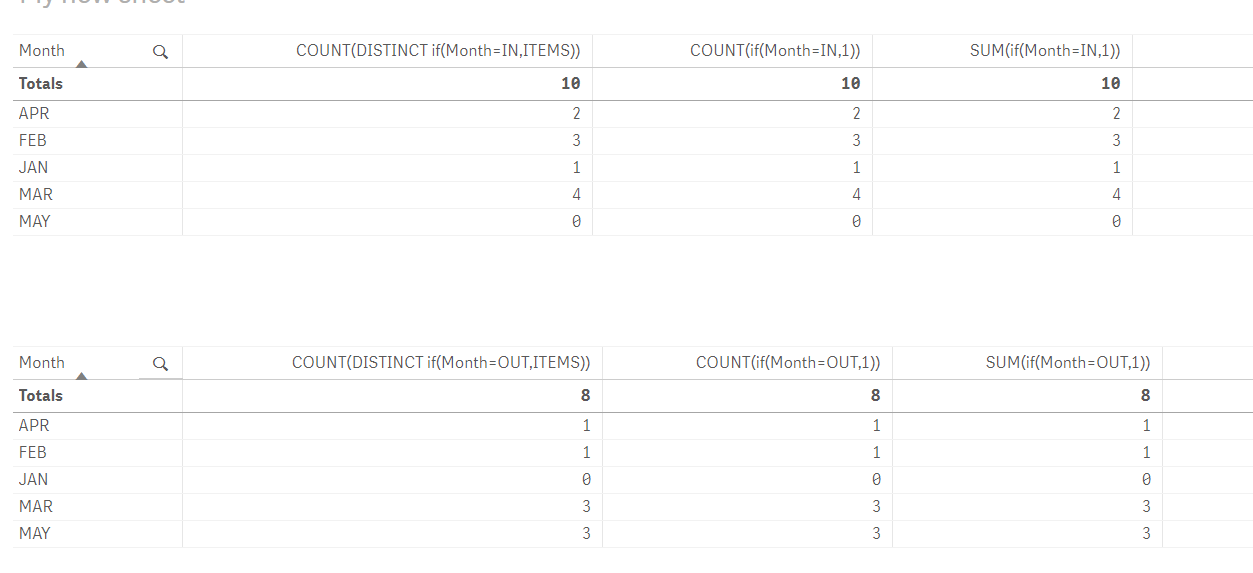
I need to create a graphic which dimension will be Month and measures will be (1) count of month occurrence as IN, and (2) count of Month occurrence in OUT.
I tried the following function with no success:
if([MONTH]=[IN],Count([IN]))
Any ideas ?
Thanks in advance.
977 Views
1 Solution
Accepted Solutions
Specialist
2018-01-05
10:17 PM
- Mark as New
- Bookmark
- Subscribe
- Mute
- Subscribe to RSS Feed
- Permalink
- Report Inappropriate Content
2 Replies
Specialist
2018-01-05
10:17 PM
- Mark as New
- Bookmark
- Subscribe
- Mute
- Subscribe to RSS Feed
- Permalink
- Report Inappropriate Content
Hi,
Few options, i hope it helps,
Cheers,
Luis
Contributor III
2018-01-06
03:54 AM
Author
- Mark as New
- Bookmark
- Subscribe
- Mute
- Subscribe to RSS Feed
- Permalink
- Report Inappropriate Content
Thanks for your help!
837 Views