Unlock a world of possibilities! Login now and discover the exclusive benefits awaiting you.
Announcements
Q&A with Qlik - Qlik Cloud Migration: Questions about migrating to Qlik Cloud? Catch the latest replay!
- Qlik Community
- :
- Forums
- :
- Analytics & AI
- :
- Products & Topics
- :
- Visualization and Usability
- :
- Help With Heat Map to Carpet Chart
Options
- Subscribe to RSS Feed
- Mark Topic as New
- Mark Topic as Read
- Float this Topic for Current User
- Bookmark
- Subscribe
- Mute
- Printer Friendly Page
Turn on suggestions
Auto-suggest helps you quickly narrow down your search results by suggesting possible matches as you type.
Showing results for
Contributor
2019-07-02
12:19 PM
- Mark as New
- Bookmark
- Subscribe
- Mute
- Subscribe to RSS Feed
- Permalink
- Report Inappropriate Content
Help With Heat Map to Carpet Chart
Hi All,
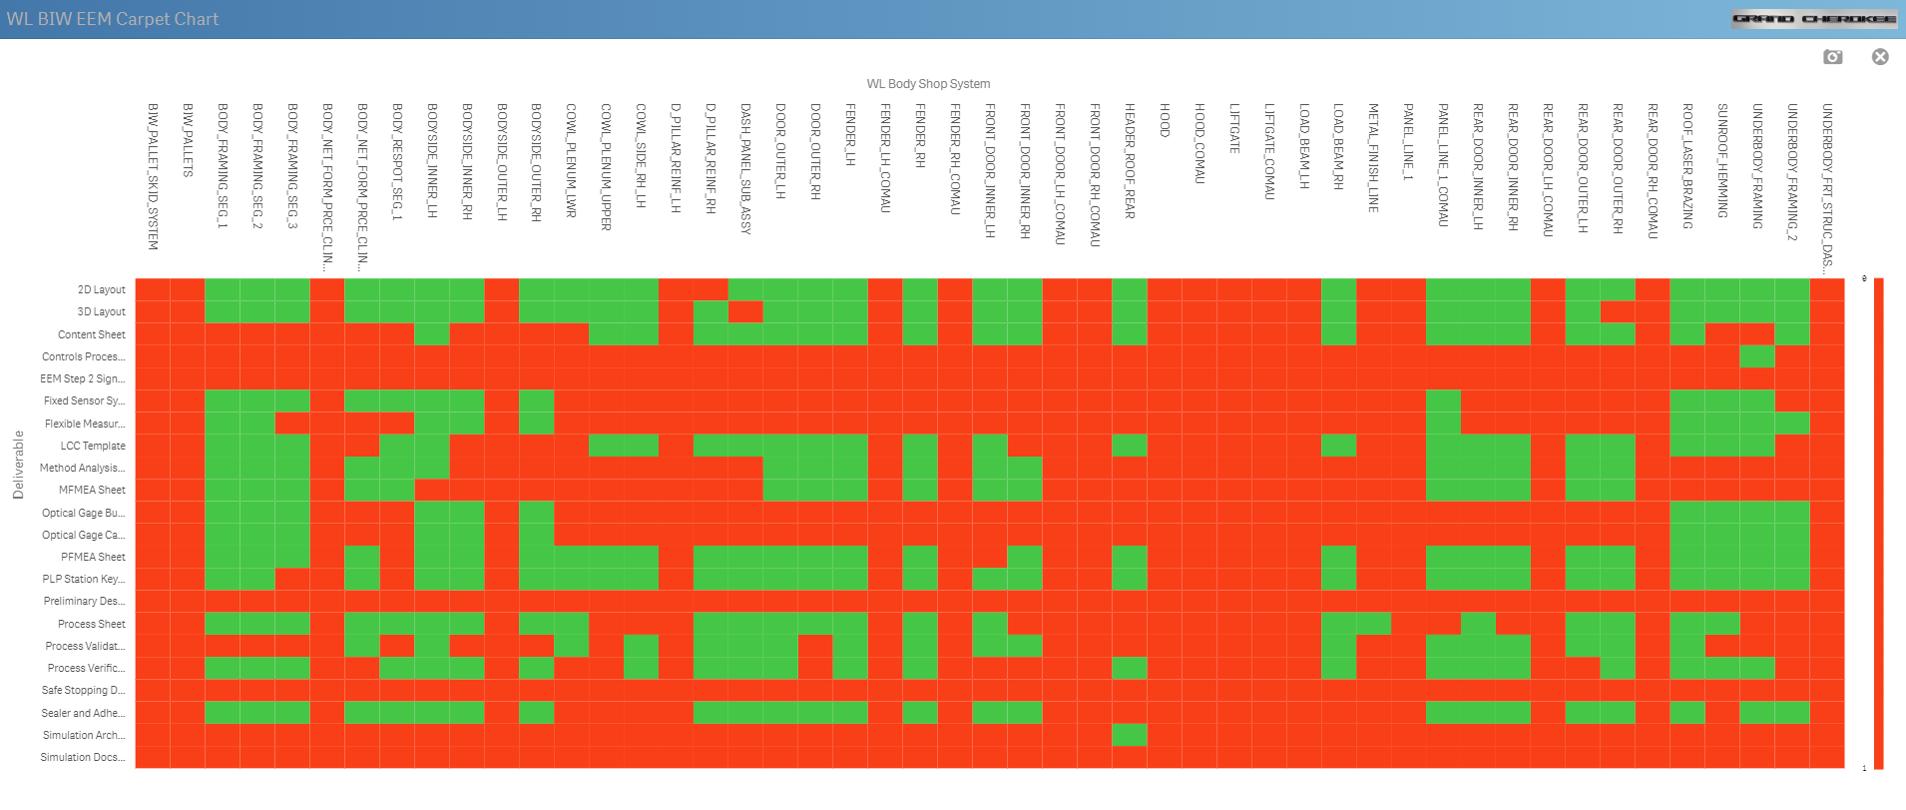
I've effectively been using a heat map as my carpet chart, Currently I have : Count({$<[Item Rev Status5]={'Approved' , 'NA'}>}[Item Rev Status5]) : GREEN
And , Count({$<[Item Rev Status5]={'Not Submitted', 'Rejected', 'In Review'}>}[Item Rev Status5]) : RED
Id like to be able to Count and make more than two colors......I have 5 Statuses.... "Approved, In Review, Rejected, Not Submitted and NA" .... Id like to get a diff color for each one....does anyone have any suggestions....
PS: They can only be in one status at a time.... Gradient scale wouldn't wont work....
Thanks!!!
1,012 Views
2 Replies
Employee
2019-07-02
07:55 PM
- Mark as New
- Bookmark
- Subscribe
- Mute
- Subscribe to RSS Feed
- Permalink
- Report Inappropriate Content
You could create an additional field with values 1-5 for each status and use that field (no aggregation) as the measure and apply the Diverging BuYlRd 5 values color schema
Contributor
2019-07-03
10:29 AM
Author
- Mark as New
- Bookmark
- Subscribe
- Mute
- Subscribe to RSS Feed
- Permalink
- Report Inappropriate Content
Great suggestion. It works great. Thank you
980 Views