Unlock a world of possibilities! Login now and discover the exclusive benefits awaiting you.
- Qlik Community
- :
- Forums
- :
- Analytics & AI
- :
- Products & Topics
- :
- Visualization and Usability
- :
- How to add a calculated column in Pivot table
- Subscribe to RSS Feed
- Mark Topic as New
- Mark Topic as Read
- Float this Topic for Current User
- Bookmark
- Subscribe
- Mute
- Printer Friendly Page
- Mark as New
- Bookmark
- Subscribe
- Mute
- Subscribe to RSS Feed
- Permalink
- Report Inappropriate Content
How to add a calculated column in Pivot table
Dear All,
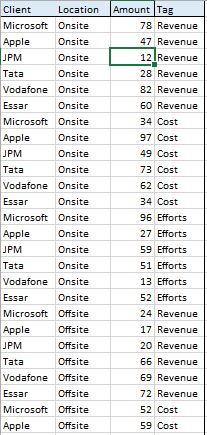
I have a data set something like this, I am trying to create a pivot table in Qlik Sense with some Calculated field.
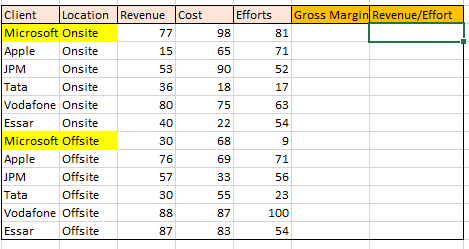
This is the desired structure of my Pivot Table. But I am facing issue with the calculated fields.
I am not finding any way to add these two calculated fields to my Pivot Table.
Any Help will be highly appreciated.
- Tags:
- pivot
- qlik technique
Accepted Solutions
- Mark as New
- Bookmark
- Subscribe
- Mute
- Subscribe to RSS Feed
- Permalink
- Report Inappropriate Content
Hello,
am I right that your datas contains 4 fields:
Client, Location, Amount and Tag?
And you created a Pivottable with 2 Fields, 1 Column (Tag) and one expression?
And now you want to add two other calulations that are not in the data....
So change your Pivot:
delete the column Tag
delete your expression
add Expression:
sum({<Tag={Revenue}>} Amount) -> Label it Revenue
sum({<Tag={Cost}>} Amount) -> Label it Cost
sum({<Tag={Efforts}>} Amount) -> Label it Efforts
Amount-Cost -> Label it Gross Margin
Revenue/Effort -> Label it Revenue/Effort
Regards
- Mark as New
- Bookmark
- Subscribe
- Mute
- Subscribe to RSS Feed
- Permalink
- Report Inappropriate Content
add measure column and what is the logic for gross margin ?
for revenue/effort create meausre as direct write sum(Revenue)/sum(effort)
- Mark as New
- Bookmark
- Subscribe
- Mute
- Subscribe to RSS Feed
- Permalink
- Report Inappropriate Content
Hello,
am I right that your datas contains 4 fields:
Client, Location, Amount and Tag?
And you created a Pivottable with 2 Fields, 1 Column (Tag) and one expression?
And now you want to add two other calulations that are not in the data....
So change your Pivot:
delete the column Tag
delete your expression
add Expression:
sum({<Tag={Revenue}>} Amount) -> Label it Revenue
sum({<Tag={Cost}>} Amount) -> Label it Cost
sum({<Tag={Efforts}>} Amount) -> Label it Efforts
Amount-Cost -> Label it Gross Margin
Revenue/Effort -> Label it Revenue/Effort
Regards
- Mark as New
- Bookmark
- Subscribe
- Mute
- Subscribe to RSS Feed
- Permalink
- Report Inappropriate Content
- Mark as New
- Bookmark
- Subscribe
- Mute
- Subscribe to RSS Feed
- Permalink
- Report Inappropriate Content
Hi Pallav,
Please find the attachment
Thanks,
Arvind Patil
- Mark as New
- Bookmark
- Subscribe
- Mute
- Subscribe to RSS Feed
- Permalink
- Report Inappropriate Content
Thanks a lot everyone.
Really appreciate your effort.
I tried something similar to @martin pohl and its working fine as of now
- Mark as New
- Bookmark
- Subscribe
- Mute
- Subscribe to RSS Feed
- Permalink
- Report Inappropriate Content
I have created a Measure for Gross Margin ,so now I have a column for Gross Margin in my pivot
but here I am strucked again
I am trying to create custom filter through which I can select data based on Gross margin.
My filter will be something like
Gross Margin
1. Below 30%
2. 30-40%
3.40%+
is this possible ??