Unlock a world of possibilities! Login now and discover the exclusive benefits awaiting you.
- Qlik Community
- :
- Forums
- :
- Analytics & AI
- :
- Products & Topics
- :
- Visualization and Usability
- :
- How to calculate average line in line chart
Options
- Subscribe to RSS Feed
- Mark Topic as New
- Mark Topic as Read
- Float this Topic for Current User
- Bookmark
- Subscribe
- Mute
- Printer Friendly Page
Turn on suggestions
Auto-suggest helps you quickly narrow down your search results by suggesting possible matches as you type.
Showing results for
Partner - Creator
2021-11-11
08:04 AM
- Mark as New
- Bookmark
- Subscribe
- Mute
- Subscribe to RSS Feed
- Permalink
- Report Inappropriate Content
How to calculate average line in line chart
Hi Folks,
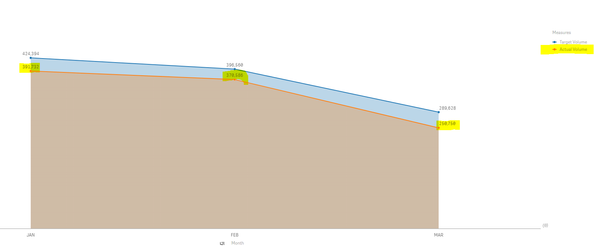
In my dashboard I have one line chart where I am showing Target Volume and Actual volume .User asked me to make new average line chart for the Actual Volume .
Jan 391732+
Feb 370586+
Mar 250750
Total Of the Actual for all 3 month=10,13,068
No of month=3
Average line =3,37,689.33
Month can be vary so how to achieve above.
1,625 Views
2 Replies
MVP
2021-11-11
09:59 AM
- Mark as New
- Bookmark
- Subscribe
- Mute
- Subscribe to RSS Feed
- Permalink
- Report Inappropriate Content
Hi, you can try adding a reference line, in the add-ons sections of the object property.
the expression for the reference line can be:
([ExpressionForActualVolume])/Count(Distinct MonthFieldName)
Specialist II
2021-11-11
09:49 PM
- Mark as New
- Bookmark
- Subscribe
- Mute
- Subscribe to RSS Feed
- Permalink
- Report Inappropriate Content
Agree with @rubenmarin .
Regards,
Abhijit
keep Qliking...
Help users find answers! Don't forget to mark a solution that worked for you!
Abhijit
keep Qliking...
Help users find answers! Don't forget to mark a solution that worked for you!
1,569 Views
