Unlock a world of possibilities! Login now and discover the exclusive benefits awaiting you.
- Qlik Community
- :
- Forums
- :
- Analytics & AI
- :
- Products & Topics
- :
- Visualization and Usability
- :
- How to create formula label for every barchart
- Subscribe to RSS Feed
- Mark Topic as New
- Mark Topic as Read
- Float this Topic for Current User
- Bookmark
- Subscribe
- Mute
- Printer Friendly Page
- Mark as New
- Bookmark
- Subscribe
- Mute
- Subscribe to RSS Feed
- Permalink
- Report Inappropriate Content
How to create formula label for every barchart
Hi all,
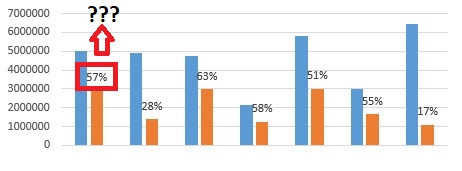
I have a barchart that shows comparison amount between Current Year and Last Year for each group. I'd like to change the value label so they will show the percentage ratio between Current vs Last Year instead of the real amount.
Please advise how can I change the value label.
FYI, I can't use combo chart because it will show the percentage using line (which is not the correct chart to use in this case since I'm not trying to show a trend between groups). Currently there's no way to remove the line, and if I change it to marker, marker point can't show value label.
- Tags:
- qlik community
- Mark as New
- Bookmark
- Subscribe
- Mute
- Subscribe to RSS Feed
- Permalink
- Report Inappropriate Content
Hi there,
have you considered using alternative measure? It's not ideal, but it's very easy to do and it has some advantages.
- Mark as New
- Bookmark
- Subscribe
- Mute
- Subscribe to RSS Feed
- Permalink
- Report Inappropriate Content
Hi,
Thank you for your response. I'm not sure how to apply alternative measure to achieve the result I needed. Can you explain more ?
- Mark as New
- Bookmark
- Subscribe
- Mute
- Subscribe to RSS Feed
- Permalink
- Report Inappropriate Content
You can use dual function together with the [Number formatting] property set to "Measure expression". I just tested it using a combo chart... maybe its also doable using a regular bar chart, but will probably require more tricks. Please review the enclosed app.