Unlock a world of possibilities! Login now and discover the exclusive benefits awaiting you.
- Qlik Community
- :
- Forums
- :
- Analytics & AI
- :
- Products & Topics
- :
- Visualization and Usability
- :
- How to make a pie chart from a count
- Subscribe to RSS Feed
- Mark Topic as New
- Mark Topic as Read
- Float this Topic for Current User
- Bookmark
- Subscribe
- Mute
- Printer Friendly Page
- Mark as New
- Bookmark
- Subscribe
- Mute
- Subscribe to RSS Feed
- Permalink
- Report Inappropriate Content
How to make a pie chart from a count
Hi! Very new to Qlik.
I am trying to make a pie chart from a count of legal matters. I simply want to count occurrences of matter origin value 'typeA' vs 'typeB' in a common field called matter_source. I chose matter_source as the dimension and then for measure, I have tried to ape other formulas online that use Count, AGGregate, etc,
Either it says field values are null, or the formula is invalid...
I am pulling from datasets from 3 different tabs in one file but I don't think it matters, matter_source is a common field on all 3.
Thank you!
- Mark as New
- Bookmark
- Subscribe
- Mute
- Subscribe to RSS Feed
- Permalink
- Report Inappropriate Content
Can you provide more details?
Data model, tables screenshot.
it does matter how do you calculate the value base on 3 tabs.
- Mark as New
- Bookmark
- Subscribe
- Mute
- Subscribe to RSS Feed
- Permalink
- Report Inappropriate Content
Have you tried
Count(matter_source)
as your Measure?
-Rob
- Mark as New
- Bookmark
- Subscribe
- Mute
- Subscribe to RSS Feed
- Permalink
- Report Inappropriate Content
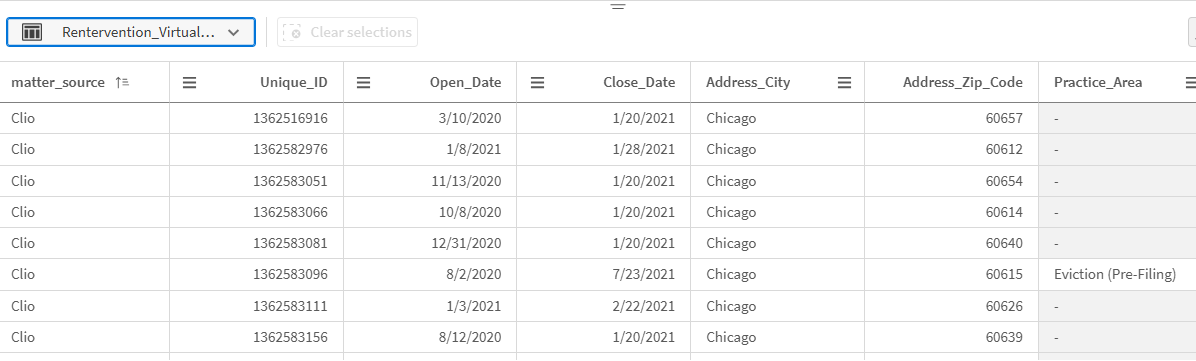
Rob W, yes, did try that -
Rob M, here are a few screenshots of the underlying data (pulling from 3 tabs). I think I also have the data model unless it is something different. Thank you!
- Mark as New
- Bookmark
- Subscribe
- Mute
- Subscribe to RSS Feed
- Permalink
- Report Inappropriate Content
If you seperate then use below
TypeA
TypeB etc....
Count({<matter_source={'typeA'}>} matter_source)
- Mark as New
- Bookmark
- Subscribe
- Mute
- Subscribe to RSS Feed
- Permalink
- Report Inappropriate Content
You need to associate the tables to one another. It does not look like you have done that.
Also, be aware that you should not use a key field for calculations as engine does not know from which table it should pull data.
BR
Lucke
- Mark as New
- Bookmark
- Subscribe
- Mute
- Subscribe to RSS Feed
- Permalink
- Report Inappropriate Content
matter_source is your dim
then Count(id)
or Count(ID)
or count(Unique_ID)
or as Lucke mentioned you need to associate the table.
matte_rsource may note the best key here
- Mark as New
- Bookmark
- Subscribe
- Mute
- Subscribe to RSS Feed
- Permalink
- Report Inappropriate Content
I followed Lucke's recommendation of associating those tabs and also Chanty's script for counting but still receive error 'The chart is not displayed because it contains only negative or zero values'... attaching the script I used here.
I feel like there must be a simpler way to do a count of these matters, with the goal of visualizing % originating from separate apps.