Unlock a world of possibilities! Login now and discover the exclusive benefits awaiting you.
- Qlik Community
- :
- Forums
- :
- Analytics & AI
- :
- Products & Topics
- :
- Visualization and Usability
- :
- Re: Line Chart with double Y-axes
- Subscribe to RSS Feed
- Mark Topic as New
- Mark Topic as Read
- Float this Topic for Current User
- Bookmark
- Subscribe
- Mute
- Printer Friendly Page
- Mark as New
- Bookmark
- Subscribe
- Mute
- Subscribe to RSS Feed
- Permalink
- Report Inappropriate Content
Line Chart with double Y-axes
Hi guys,
I need to produce the following Line Chart.
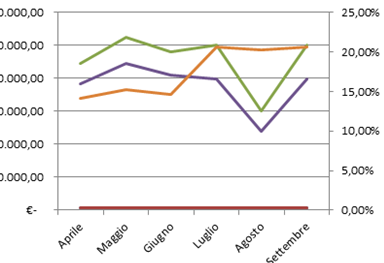
My problem is the following one: I'm able to create it but i don't know how to insert the second Y-axes (with the percentage that is inside of my CrossTable). Anyone have an idea?
Thanks in advance,
Ale
- Mark as New
- Bookmark
- Subscribe
- Mute
- Subscribe to RSS Feed
- Permalink
- Report Inappropriate Content
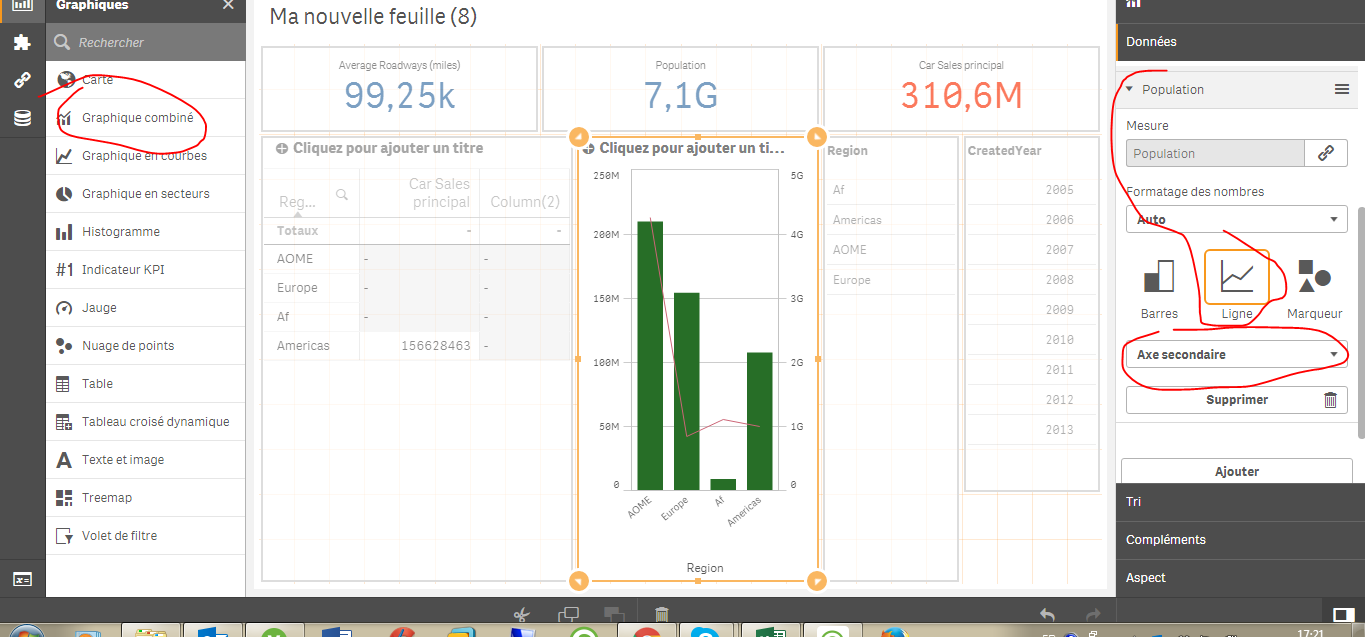
To be able to add 2 Y-axis, you need to use a combined chart; and the seconde measure must be of a different form then the first measure.
exp: firest measures bar, 2nd measure, lines:
You can have for example:
dimension:
Month:
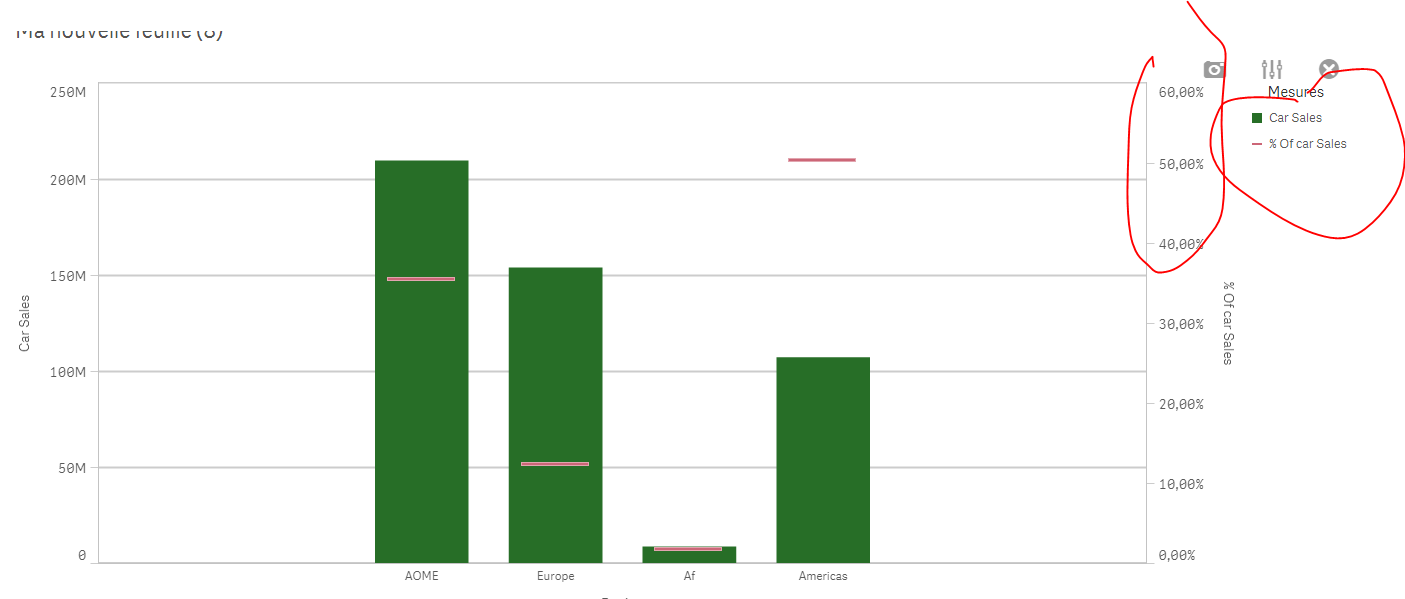
Measure 1 :sum(Sales)
measure 2: sum(Sales) / sum(Total Sales) and format it as %:
- Mark as New
- Bookmark
- Subscribe
- Mute
- Subscribe to RSS Feed
- Permalink
- Report Inappropriate Content
I really thank you for the answer!
The problem is I need two dimensions and two measures in a line chart and, with the combo box, i can add only one dimension.
any ideas?
Thanks in advance,
Ale
- Mark as New
- Bookmark
- Subscribe
- Mute
- Subscribe to RSS Feed
- Permalink
- Report Inappropriate Content
you can do this with a COMBO chart and then change the BAR chart to also be a line chart. Data > Dimensions > Measures > More Properties > Presentation. (not to be confused with Appearance > Presentation) . then you will have a chart, with multiple lines and 2 different Y axis. can only have one dimension though in the combo chart
- Mark as New
- Bookmark
- Subscribe
- Mute
- Subscribe to RSS Feed
- Permalink
- Report Inappropriate Content
Split Y-axis is currently not supported in Qlik Sense line chart object.
you can use combo chart to display data Y -axis left and right part.