Unlock a world of possibilities! Login now and discover the exclusive benefits awaiting you.
- Qlik Community
- :
- Forums
- :
- Analytics & AI
- :
- Products & Topics
- :
- Visualization and Usability
- :
- Need to have duplicate results show
- Subscribe to RSS Feed
- Mark Topic as New
- Mark Topic as Read
- Float this Topic for Current User
- Bookmark
- Subscribe
- Mute
- Printer Friendly Page
- Mark as New
- Bookmark
- Subscribe
- Mute
- Subscribe to RSS Feed
- Permalink
- Report Inappropriate Content
Need to have duplicate results show
I am trying to make a dashboard to track duplicate results in our data. I am currently struggling to get a count and identify these duplicate records.
I have three columns with data similar to below
| ID | Location | Terms |
|---|---|---|
| 1 | A | Net 0 |
| 1 | B | Net 30 |
| 1 | B | Net 0 |
| 1 | C | Net60 |
| 2 | B | Net 60 |
The way the data is structured is that an ID can have multiple locations underneath it but each location should only be associated with the ID once, ensuring only one set of terms for each location. So what I need to identify is a duplicate Location under an ID. The goal is to pinpoint multiple sets of terms for a Location on an ID record.
In the above example, I'd want to identify the two B locations under ID 1. I wouldn't care about Location B under ID 2. By "under" I am thinking of this in terms of a pivot table (but the solution doesn't have to be in a pivot table).
Thanks in advance for help!!
Accepted Solutions
- Mark as New
- Bookmark
- Subscribe
- Mute
- Subscribe to RSS Feed
- Permalink
- Report Inappropriate Content
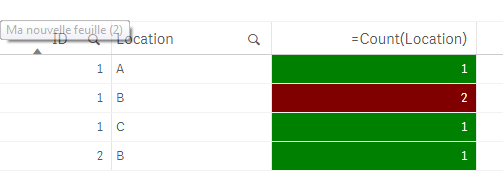
A simple table:
as dimensions: ID, Location
as measure: count(Location)
As color background:
if( count(Location)>1,red(),green())
- Mark as New
- Bookmark
- Subscribe
- Mute
- Subscribe to RSS Feed
- Permalink
- Report Inappropriate Content
Try a chart with two dimensions, ID and Location, and an expression like
=Count(Location)
or
=Count(DISTINCT Terms)
Where every you see more than '1', there is an issue.
You can also use
=Count(Location) > 1
and then filter the results (hide rows with result zero).
- Mark as New
- Bookmark
- Subscribe
- Mute
- Subscribe to RSS Feed
- Permalink
- Report Inappropriate Content
Stefan,
I previously added a Count(Terms) as a measure to my pivot table but the issue is that each ID has lots of terms and that is acceptable. The issue arises when a single location has lots of terms. I have an ID with 25 terms but when I expand on location, each location only has one term associated with it (which is correct). If it has more than 1, it's wrong but I definitely don't want to have to drill down into each of the 60K IDs.
I don't believe I can do count location either because each ID will have lots of locations.
I guess I could do a Count(Location) and a Count(terms) and if the 2 counts don't match there is an issue. Is there a way to limit to only those? Or highlight those IDs?
- Mark as New
- Bookmark
- Subscribe
- Mute
- Subscribe to RSS Feed
- Permalink
- Report Inappropriate Content
A simple table:
as dimensions: ID, Location
as measure: count(Location)
As color background:
if( count(Location)>1,red(),green())
- Mark as New
- Bookmark
- Subscribe
- Mute
- Subscribe to RSS Feed
- Permalink
- Report Inappropriate Content
Omar,
This, in association with my pivot table with ID, Location and Terms, has helped me identify these! Thanks so much!
- Mark as New
- Bookmark
- Subscribe
- Mute
- Subscribe to RSS Feed
- Permalink
- Report Inappropriate Content
Coming across an interesting issue. Some of the data points have duplicate Location but the terms are the same. Is there a way to differentiate this?
Example:
ID Location Term
3 B Net0
3 B Net 0
3 B Net 0
4 G Net 30
4 G Net 60
4 G Net 1
In the above example ID 4 is more important because of the conflicting information but I'd like to know that there is duplicate information on ID 3.
Thanks in advance!
- Mark as New
- Bookmark
- Subscribe
- Mute
- Subscribe to RSS Feed
- Permalink
- Report Inappropriate Content
Like I suggested in my first post, you can do a distinct count of the terms (still grouped by your two dimensions):
=Count(DISTINCT Term)
- Mark as New
- Bookmark
- Subscribe
- Mute
- Subscribe to RSS Feed
- Permalink
- Report Inappropriate Content
Thank you so much! I apologize for my confusion! Y'all are the best!