Unlock a world of possibilities! Login now and discover the exclusive benefits awaiting you.
- Qlik Community
- :
- Forums
- :
- Analytics & AI
- :
- Products & Topics
- :
- Visualization and Usability
- :
- Re: Question on pivot tables (Total row and additi...
- Subscribe to RSS Feed
- Mark Topic as New
- Mark Topic as Read
- Float this Topic for Current User
- Bookmark
- Subscribe
- Mute
- Printer Friendly Page
- Mark as New
- Bookmark
- Subscribe
- Mute
- Subscribe to RSS Feed
- Permalink
- Report Inappropriate Content
Question on pivot tables (Total row and additional column)
Hi,
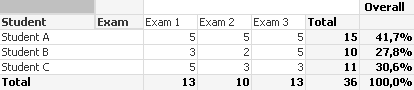
I'm new with QlikSense, I made a pivot table for the scores of each student for three types of exam. Below is a sample data:
| Student/Subject | Exam 1 | Exam 2 | Exam 3 | Total | % of Overall |
|---|---|---|---|---|---|
| Student A | 5 | 5 | 5 | 15 | 15/36 = 41.6% |
| Student B | 3 | 2 | 5 | 10 | 10/36 = 27.8% |
| Student C | 5 | 3 | 3 | 11 | 11/36 = 30.6% |
| Total | 13 | 10 | 13 | 36 |
Need some help on the following items:
- I can't seem to find any option to put the TOTAL row and column to the end of the table, unlike in straight tables where I'm able to choose where I want the TOTALS to appear
- Is there a way to add a column to show the percent of each student's total score to the overall score? When I tried defining a new measure, an additional column appeared for each exam type
Thanks in advance!
Accepted Solutions
- Mark as New
- Bookmark
- Subscribe
- Mute
- Subscribe to RSS Feed
- Permalink
- Report Inappropriate Content
Think adding an extension is your best bet - Qlik Sense - Pivot Table Extension
The native pivot table doesn't have totals.
- Mark as New
- Bookmark
- Subscribe
- Mute
- Subscribe to RSS Feed
- Permalink
- Report Inappropriate Content
Hi, you can set the totals up or down in the presentation tab.
There is only one Total by dimension, one trick to add another total row is adding a dummy dimension, check attachment to see how is done.
- Mark as New
- Bookmark
- Subscribe
- Mute
- Subscribe to RSS Feed
- Permalink
- Report Inappropriate Content
Thanks for the info!
However, I can't seem to find the "Presentation" tab in QlikSense.
Will check the attachment 
- Mark as New
- Bookmark
- Subscribe
- Mute
- Subscribe to RSS Feed
- Permalink
- Report Inappropriate Content
Ops, sorry, I didn't see it was for Sense, my answer was QlikView based.
- Mark as New
- Bookmark
- Subscribe
- Mute
- Subscribe to RSS Feed
- Permalink
- Report Inappropriate Content
Think adding an extension is your best bet - Qlik Sense - Pivot Table Extension
The native pivot table doesn't have totals.
- Mark as New
- Bookmark
- Subscribe
- Mute
- Subscribe to RSS Feed
- Permalink
- Report Inappropriate Content
Qlik Sense charts in general are very prescriptive in their setup and application.
Totals for columns appear at the front of the chart because of the responsive environment it works in they thought the total was important and should always be visible to the user if selected regardless of the device they are viewing the chart on.
Totals for rows appear under the row selected for each column. They do not allow movement of layout for this although in the latest release there is the capability for users to customise charts to certain extent so manipulating the layout.
Regards
Andy
- Mark as New
- Bookmark
- Subscribe
- Mute
- Subscribe to RSS Feed
- Permalink
- Report Inappropriate Content
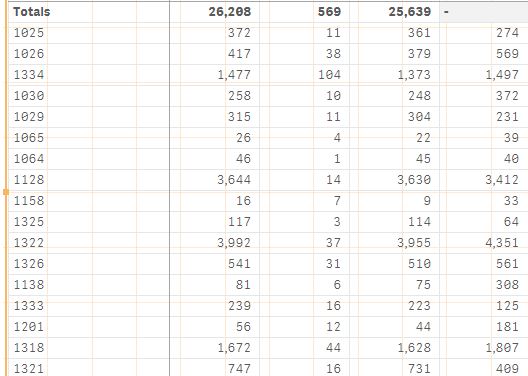
Can someone help me with the below i am trying to add the column total for the last column
- Mark as New
- Bookmark
- Subscribe
- Mute
- Subscribe to RSS Feed
- Permalink
- Report Inappropriate Content
Usually this is because of the expression is calculated by each dimension value, you can try with:
Sum(Aggr(YourExpression, DimensionField))
Creating a new question will help to get answers if this doesn't works.
- Mark as New
- Bookmark
- Subscribe
- Mute
- Subscribe to RSS Feed
- Permalink
- Report Inappropriate Content
Hi Andrew,
Do we have the similar feature in Qlikview, i just want to create an another new column which shows my total for each row..
my requirement in Qlikview is similar like @homar question.
Please let me know thanks much..!!