Unlock a world of possibilities! Login now and discover the exclusive benefits awaiting you.
- Qlik Community
- :
- Forums
- :
- Analytics & AI
- :
- Products & Topics
- :
- Visualization and Usability
- :
- Re: How to display /sort year in a line graph
- Subscribe to RSS Feed
- Mark Topic as New
- Mark Topic as Read
- Float this Topic for Current User
- Bookmark
- Subscribe
- Mute
- Printer Friendly Page
- Mark as New
- Bookmark
- Subscribe
- Mute
- Subscribe to RSS Feed
- Permalink
- Report Inappropriate Content
Re: How to display /sort year in a line graph
Hi,
I have a data set that has financial information from 1980 to 2018 I only want to create a line graph showing the information from 2010 - 2018. how do i achieve this please assist.
Thank you
Regards
Saran
- Tags:
- saran
- « Previous Replies
-
- 1
- 2
- Next Replies »
- Mark as New
- Bookmark
- Subscribe
- Mute
- Subscribe to RSS Feed
- Permalink
- Report Inappropriate Content
Use below as dimension
IF(Year >= 2010,Year)
Tick Suppress When Value is Null
- Mark as New
- Bookmark
- Subscribe
- Mute
- Subscribe to RSS Feed
- Permalink
- Report Inappropriate Content
... and sort as Numeric value
- Mark as New
- Bookmark
- Subscribe
- Mute
- Subscribe to RSS Feed
- Permalink
- Report Inappropriate Content
it is still displaying all years
- Mark as New
- Bookmark
- Subscribe
- Mute
- Subscribe to RSS Feed
- Permalink
- Report Inappropriate Content
I have tried this but there is an issue with the function
- Mark as New
- Bookmark
- Subscribe
- Mute
- Subscribe to RSS Feed
- Permalink
- Report Inappropriate Content
Make sure you use the equal sign in the dimension and that your year dimension is called 'Year':
=IF(Year >= 2010,Year)
Upload a screenshot of your dimension if it does not work.
Regards,
Sorin.
- Mark as New
- Bookmark
- Subscribe
- Mute
- Subscribe to RSS Feed
- Permalink
- Report Inappropriate Content
- Mark as New
- Bookmark
- Subscribe
- Mute
- Subscribe to RSS Feed
- Permalink
- Report Inappropriate Content
=IF(deposit_date >= 2015,deposit_date)
I used this but it is still displaying data from 1973 ..
i need to show data from 2010 only
- Mark as New
- Bookmark
- Subscribe
- Mute
- Subscribe to RSS Feed
- Permalink
- Report Inappropriate Content
Saran, you need to convert the deposit_date to Year format. Your dimension then will be:
=IF(Year(deposit_date) >= 2015,deposit_date)
- Mark as New
- Bookmark
- Subscribe
- Mute
- Subscribe to RSS Feed
- Permalink
- Report Inappropriate Content
| deposit_date | currency_id | amount_usd | |
| 167 | 397142 | |
| 167 | 401276 | |
| 167 | 325019 | |
| 167 | 108586 | |
| 167 | 34519 | |
| 167 | 559 | |
| 10/12/2015 | 167 | 70049.03 | |
| 09/12/2015 | 167 | 212031.56 | |
| 08/12/2016 | 167 | 209878.95 | |
| 07/12/2011 | 29 | 454545.45 |
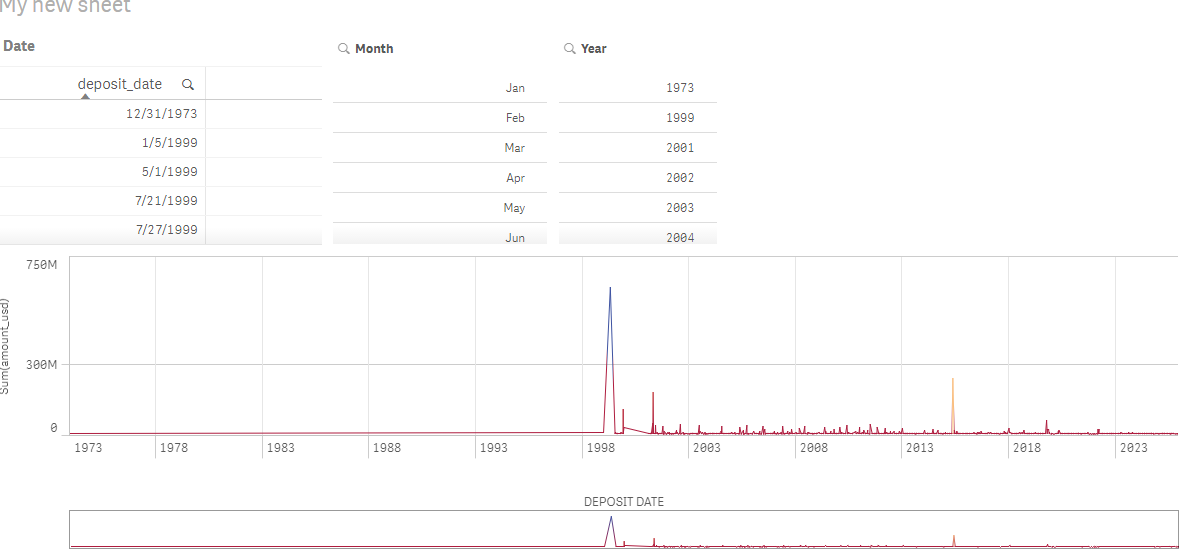
This is a sample of the data i have
- « Previous Replies
-
- 1
- 2
- Next Replies »