Unlock a world of possibilities! Login now and discover the exclusive benefits awaiting you.
Announcements
Now accepting applications for the Qlik Luminary and Partner Ambassador Programs: Apply by July 6!
- Qlik Community
- :
- Forums
- :
- Analytics & AI
- :
- Products & Topics
- :
- Visualization and Usability
- :
- Scatter plot with logarithmic scale
Options
- Subscribe to RSS Feed
- Mark Topic as New
- Mark Topic as Read
- Float this Topic for Current User
- Bookmark
- Subscribe
- Mute
- Printer Friendly Page
Turn on suggestions
Auto-suggest helps you quickly narrow down your search results by suggesting possible matches as you type.
Showing results for
Creator
2016-09-09
08:11 AM
- Mark as New
- Bookmark
- Subscribe
- Mute
- Subscribe to RSS Feed
- Permalink
- Report Inappropriate Content
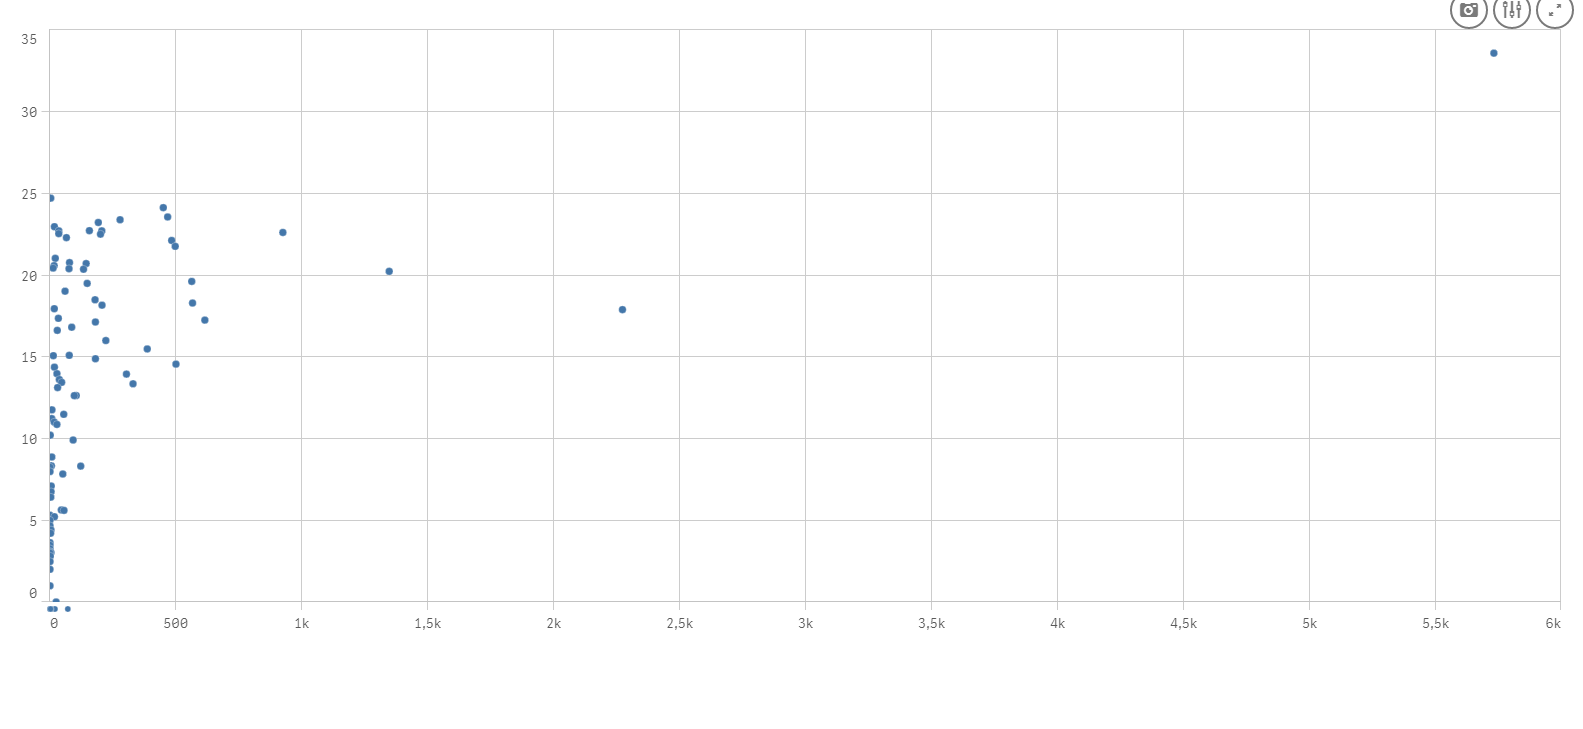
Scatter plot with logarithmic scale
Hi all
Would like to set the x-axis in a scatter plot to be logarithmic. Is there any way I can do this?
Please see attached figure.
The x-axis has a range from 0-5700, where the majority of the data plots around 10-200, and only one value at 5700
I appreciate all suggestions!
Thanks
2 Replies
Partner - Contributor II
2020-04-20
05:11 AM
- Mark as New
- Bookmark
- Subscribe
- Mute
- Subscribe to RSS Feed
- Permalink
- Report Inappropriate Content
Hello Qlik members
Is this issue solved..?
I have stuck in a same situation where i have 5000 data points and need a Log scale scatter plot chart.
Partner - Contributor
2022-10-13
03:07 PM
- Mark as New
- Bookmark
- Subscribe
- Mute
- Subscribe to RSS Feed
- Permalink
- Report Inappropriate Content
Still not solved as far as I can tell.
Add log scale option for y axis in scatter plots - Qlik Community - 1733641
1,871 Views