Unlock a world of possibilities! Login now and discover the exclusive benefits awaiting you.
- Qlik Community
- :
- Forums
- :
- Analytics & AI
- :
- Products & Topics
- :
- Visualization and Usability
- :
- Set analysis question re line graphs/yearly compar...
- Subscribe to RSS Feed
- Mark Topic as New
- Mark Topic as Read
- Float this Topic for Current User
- Bookmark
- Subscribe
- Mute
- Printer Friendly Page
- Mark as New
- Bookmark
- Subscribe
- Mute
- Subscribe to RSS Feed
- Permalink
- Report Inappropriate Content
Set analysis question re line graphs/yearly comparison
Hi,
I have a calculation of 'utlisation' app which shows the %-age of 'productive' vs 'indirect' labour hours, based on a 'labour type' of I or P.
This works fine so far but I want to extent this to show the productive percentage year on year.
The calculations I have used so far is for '%-Age' is: Sum(LabourHrsExclHoliday) / Sum(TOTAL(LabourHrsExclHoliday)), which correctly shows the breakdown between I and P hours for the selections made.
In a new line graph, I'd like to show on the %-Age (as defined above) for the P hours only, for a range of years. Whenever I have >1 year selected, the figures change as (I assume) the TOTAL function is recalculating.
How do I use Set Analysis (if this is the right approach?) to show results for productive hrs only and have the percentage shown correctly for each year? I've tried doing this in a data table first before I attempt the graph but can't figure out the use of '1' vs '$' qualifier (if that's even what's required)
Thanks.
- Mark as New
- Bookmark
- Subscribe
- Mute
- Subscribe to RSS Feed
- Permalink
- Report Inappropriate Content
App attached
- Mark as New
- Bookmark
- Subscribe
- Mute
- Subscribe to RSS Feed
- Permalink
- Report Inappropriate Content
Hi,
this is your expression:
Sum(({<LabourType={'P'}>}LabourHrsExclHoliday) / Sum(TOTAL(LabourHrsExclHoliday))
this is what you need:
Sum({<LaborType={'P'}>}LabourHrsExclHoliday) / Sum(TOTAL(LabourHrsExclHoliday))
syntax error
- Mark as New
- Bookmark
- Subscribe
- Mute
- Subscribe to RSS Feed
- Permalink
- Report Inappropriate Content
Thanks for your reply. This cleared up the syntax error, but I can't get the logic to work as I want.
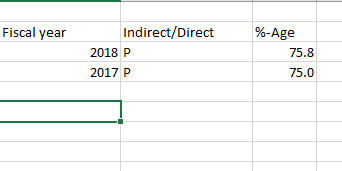
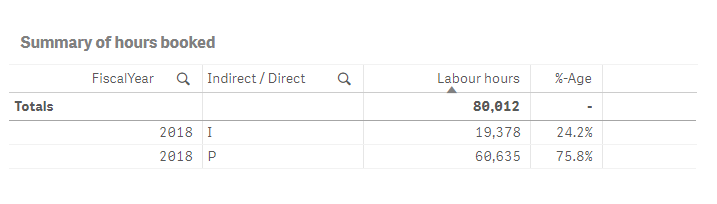
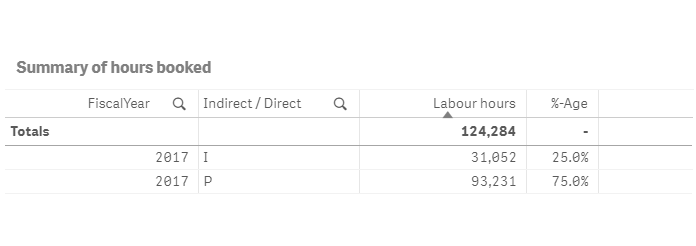
If I look at this info, for 2018, it's good (image 1) 75.8% of the hours used are P(roductive). Also ok for 2017 (image 2)
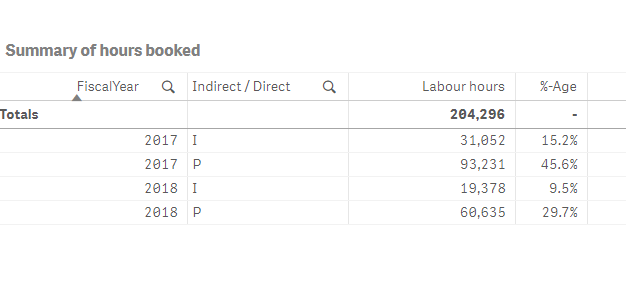
But when I select 2017 and 2018 together, the %-age figures are wrong (image 3). What I'd like to see is per image 4.
I'm assuming if i can get the syntax correct and get this correct in a datatable I'll then be able to setup a line graph to show this (and if fact I then need to include a month dimension also).
Thanks for your help, it's appreciated.
1
2
3
4