Unlock a world of possibilities! Login now and discover the exclusive benefits awaiting you.
- Qlik Community
- :
- Forums
- :
- Analytics & AI
- :
- Products & Topics
- :
- Visualization and Usability
- :
- Showing positive and negative values in bar chart
- Subscribe to RSS Feed
- Mark Topic as New
- Mark Topic as Read
- Float this Topic for Current User
- Bookmark
- Subscribe
- Mute
- Printer Friendly Page
- Mark as New
- Bookmark
- Subscribe
- Mute
- Subscribe to RSS Feed
- Permalink
- Report Inappropriate Content
Showing positive and negative values in bar chart
Hi Experts,
My requirement is adding positive and negative values in bar chart. is there any way to show bar chart in both direction (postive and negative)?
Thanks & Regards,
Pooja Singh
- Mark as New
- Bookmark
- Subscribe
- Mute
- Subscribe to RSS Feed
- Permalink
- Report Inappropriate Content
you want to show ur bar chart in 2 directions, but keep the valuepositive for both measures?
- Mark as New
- Bookmark
- Subscribe
- Mute
- Subscribe to RSS Feed
- Permalink
- Report Inappropriate Content
if it's so; please refer to this:
How to create a Butterfly (Tornado) Chart in Qlik Sense
if u have one positive measure and one negative measure, you just add them as 2 measures in ur bar chart without changing a thing and u'll have ur bar automatically in both directions
- Mark as New
- Bookmark
- Subscribe
- Mute
- Subscribe to RSS Feed
- Permalink
- Report Inappropriate Content
Hi Omar,
Thanks for your reply . I gone through your following article but that is not my requirement. For me I need one dimension with single expression and that expression has both positive and negative no. In my bar chart I want to show both positive and negative bars.
Thanks,
Pooja
- Mark as New
- Bookmark
- Subscribe
- Mute
- Subscribe to RSS Feed
- Permalink
- Report Inappropriate Content
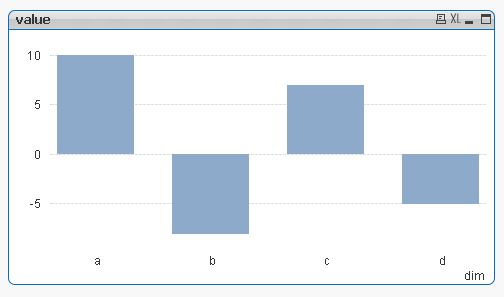
Like this?
- Mark as New
- Bookmark
- Subscribe
- Mute
- Subscribe to RSS Feed
- Permalink
- Report Inappropriate Content
yes  exactly like this.
- Mark as New
- Bookmark
- Subscribe
- Mute
- Subscribe to RSS Feed
- Permalink
- Report Inappropriate Content
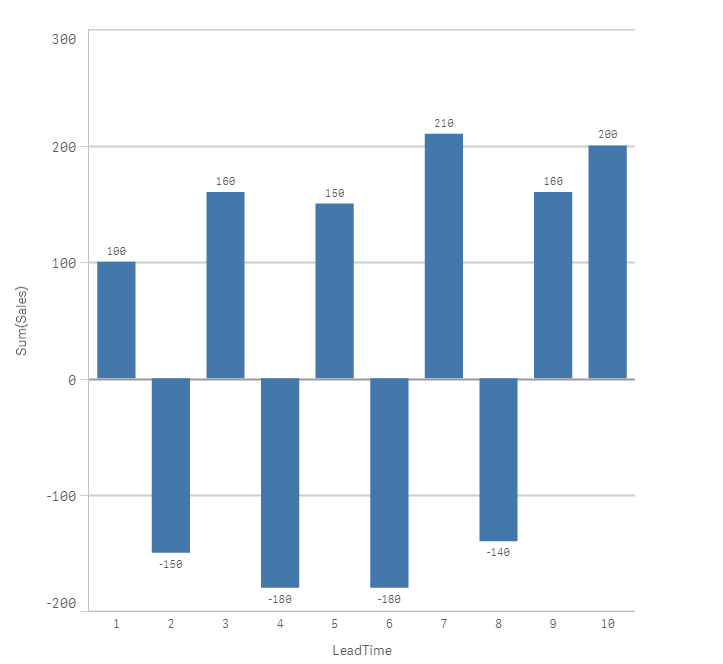
then just create a bar chart, put ur dimension and ur measure and it will automatically happens:
example:
dim : LeadTime
measure: sum(Sales) : it contians both negative and postive values
reuslt:
- Mark as New
- Bookmark
- Subscribe
- Mute
- Subscribe to RSS Feed
- Permalink
- Report Inappropriate Content
Pooja,
Create the flag in back-end by,
If(your_measure>0,1,0) as Num_flag
After loading, create the bar chart having two dimension(Your Dimension, Num_flag) and the measure(Your_measure).
- Mark as New
- Bookmark
- Subscribe
- Mute
- Subscribe to RSS Feed
- Permalink
- Report Inappropriate Content
Hi Omar .. some how its not working for me . Anyway got some idea from your butterfly chart thins.
Thanks
Pooja
- Mark as New
- Bookmark
- Subscribe
- Mute
- Subscribe to RSS Feed
- Permalink
- Report Inappropriate Content
Hi Mohan,
I got my answer and actually I don't require flag things. Thanks for your reply.
Regards,
Pooja