Unlock a world of possibilities! Login now and discover the exclusive benefits awaiting you.
- Qlik Community
- :
- Forums
- :
- Analytics & AI
- :
- Products & Topics
- :
- Visualization and Usability
- :
- Sorting When Variables are used in Dimension
- Subscribe to RSS Feed
- Mark Topic as New
- Mark Topic as Read
- Float this Topic for Current User
- Bookmark
- Subscribe
- Mute
- Printer Friendly Page
- Mark as New
- Bookmark
- Subscribe
- Mute
- Subscribe to RSS Feed
- Permalink
- Report Inappropriate Content
Sorting When Variables are used in Dimension
Hi ,
I have a kind of confusing question here!
If you look at the graph below, it uses Variables to to be filtered by which is a dimension as follows:
=if($(vselector2)=1,[Fiscal Year],
if($(vselector2)=2,[Fiscal Quarter],
if($(vselector2)=3,[FiscalMonth1])))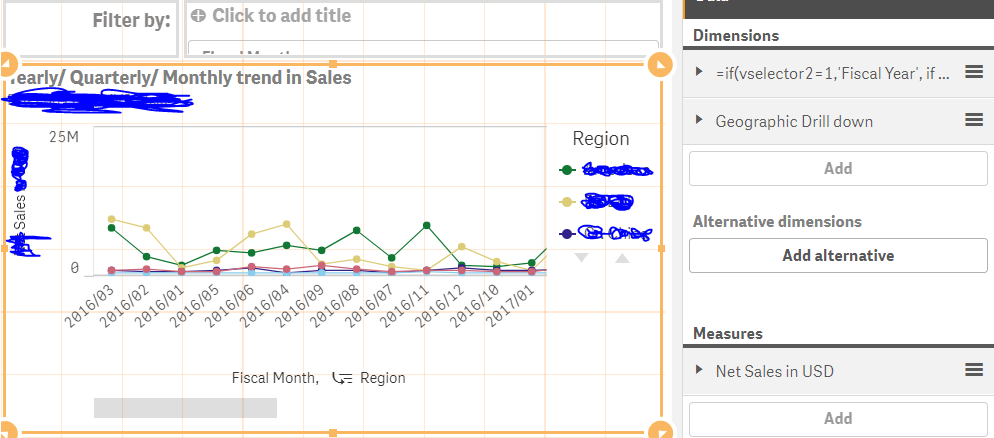
And I have sorted it using Expression: NUM(Replace([Fiscal Quarter],'-Q','')) to get the Quarters sorted right.
However, the months now are not sorted correctly and I'm unsure how to do this because month is not a separate dimension. Quarter, month and year are a part of the variable the graph will get filtered by as given in green above.
How do I get year months and quarters sorted in ascending order when the respective filter is chosen