Unlock a world of possibilities! Login now and discover the exclusive benefits awaiting you.
- Qlik Community
- :
- Forums
- :
- Analytics & AI
- :
- Products & Topics
- :
- Visualization and Usability
- :
- Transpose columns in the display
- Subscribe to RSS Feed
- Mark Topic as New
- Mark Topic as Read
- Float this Topic for Current User
- Bookmark
- Subscribe
- Mute
- Printer Friendly Page
- Mark as New
- Bookmark
- Subscribe
- Mute
- Subscribe to RSS Feed
- Permalink
- Report Inappropriate Content
Transpose columns in the display
Hi,
In the database, I have a large table that i load in the load editor part of which looks like this:
| Country | Year | Sales |
| Japan | 2010 | 10 |
| Japan | 2011 | 11 |
| Japan | 2012 | 12 |
| Japan | 2013 | 13 |
| Japan | 2014 | 14 |
| Germany | 2010 | 100 |
| Germany | 2011 | 110 |
| Germany | 2012 | 120 |
| Germany | 2013 | 130 |
| Germany | 2014 | 140 |
| UK | 2010 | 1000 |
| UK | 2011 | 1100 |
| UK | 2012 | 1200 |
| UK | 2013 | 1300 |
| UK | 2014 | 1400 |
I am trying to use the data above to display the following table:
| Country | Total Sales | Year 2010 | Year 2011 | Year 2012 | Year 2013 | Year 2014 |
| Japan | 60 | 10 | 11 | 12 | 13 | 14 |
| Germany | 600 | 100 | 110 | 120 | 130 | 140 |
| UK | 6000 | 1000 | 1100 | 1200 | 1300 | 1400 |
Could you please suggest a solution to this. Thanks for the help.
Regards,
Ra
- « Previous Replies
-
- 1
- 2
- Next Replies »
- Mark as New
- Bookmark
- Subscribe
- Mute
- Subscribe to RSS Feed
- Permalink
- Report Inappropriate Content
Hello!
Use pivot table:
- Mark as New
- Bookmark
- Subscribe
- Mute
- Subscribe to RSS Feed
- Permalink
- Report Inappropriate Content
Agreed pivot your data.
- Mark as New
- Bookmark
- Subscribe
- Mute
- Subscribe to RSS Feed
- Permalink
- Report Inappropriate Content
I have just tried pivot table and i think i did everything right but i see only the totals and nothing within the table for the sales by country.
Any other suggestion to represent this please.
- Mark as New
- Bookmark
- Subscribe
- Mute
- Subscribe to RSS Feed
- Permalink
- Report Inappropriate Content
Thanks Andy. I have just tried the pivot table and i think i did everything right but i see only the totals and nothing within the table for the sales by country.
Any other suggestion to represent this please.
- Mark as New
- Bookmark
- Subscribe
- Mute
- Subscribe to RSS Feed
- Permalink
- Report Inappropriate Content
can you post an image? you have the data to show it.
- Mark as New
- Bookmark
- Subscribe
- Mute
- Subscribe to RSS Feed
- Permalink
- Report Inappropriate Content
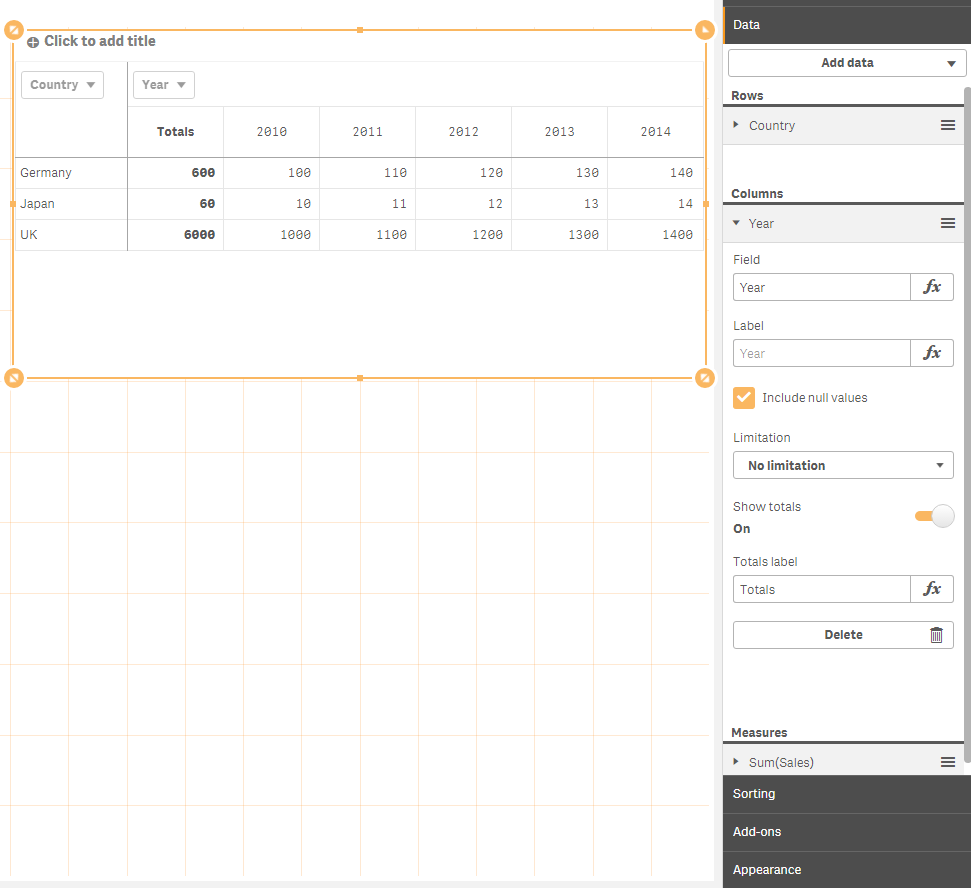
Set your country field as a row and your year field as a column and then sum(sales) as your measure.
You should have all you need to produce what you want.
- Mark as New
- Bookmark
- Subscribe
- Mute
- Subscribe to RSS Feed
- Permalink
- Report Inappropriate Content
Thanks Andy. that is exactly what i have done. I have attached a screenshot. the data i am using here is similar to that i provided in this question but a bit confidential hence hiding it.
i dont know why i only get the aggregate number per year at the top.
if you can please think of a solution or an alternative way, that would great. thanks again.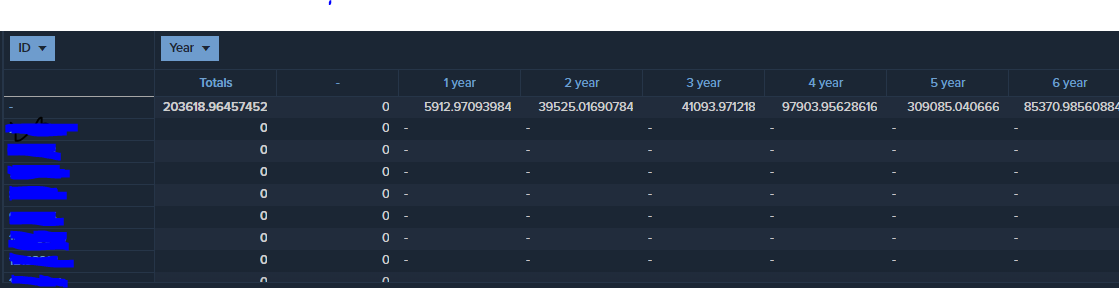
- Mark as New
- Bookmark
- Subscribe
- Mute
- Subscribe to RSS Feed
- Permalink
- Report Inappropriate Content
Suggests to me your sales data isn't associated by country properly just year.
- Mark as New
- Bookmark
- Subscribe
- Mute
- Subscribe to RSS Feed
- Permalink
- Report Inappropriate Content
To test this remove the year from your piviot and see what happens I think you'll see sales summaries on the null country value.
- « Previous Replies
-
- 1
- 2
- Next Replies »