Unlock a world of possibilities! Login now and discover the exclusive benefits awaiting you.
- Qlik Community
- :
- Forums
- :
- Analytics & AI
- :
- Products & Topics
- :
- Visualization and Usability
- :
- Using FirstSortedRow in the BAR section of a stack...
- Subscribe to RSS Feed
- Mark Topic as New
- Mark Topic as Read
- Float this Topic for Current User
- Bookmark
- Subscribe
- Mute
- Printer Friendly Page
- Mark as New
- Bookmark
- Subscribe
- Mute
- Subscribe to RSS Feed
- Permalink
- Report Inappropriate Content
Using FirstSortedRow in the BAR section of a stacked bar chart.
Hi
I have three tables. A member table, a Member Category and a Rule table.
tblMember:
UniqueID, Name
tblCategory:
UniqueID, date, Rule
tblRules:
Rule, CategoryName
My calculation which is working fine in a table takes the most recent Category Name per Member is:
=FirstSortedValue ( {< date= {"<$(vEndDate)"} >} CategoryName, - date )
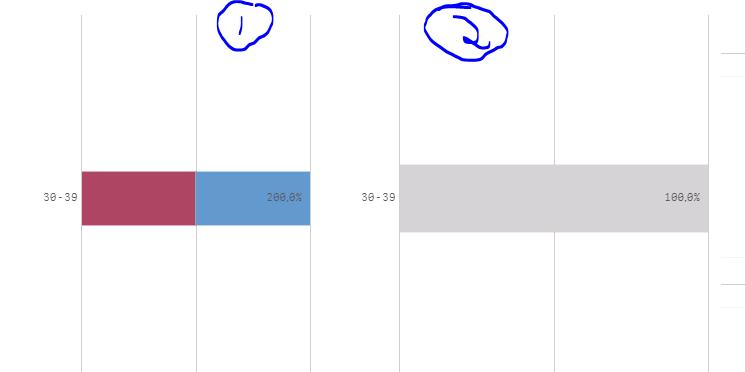
Attachment Image, "Capture":
I have shown what one Member's stacked bar chart looks like when I just add CategoryName as the Bar section. (1) It is however incorrect to display the data from anything other than the most recent CategoryName.
However I want to only use the most recent as the bar, not all of the CategoryName. So I used the following calculation, however it shows CategoryName as null and doesn't show the most recent CategoryName ?! (2)
=AGGR(FirstSortedValue ( {< dteEffectiveDate = {"<$(vEndDate)"} >} txtCategoryName , - dteEffectiveDate ), MemberID )
What could be causing this? Is the AGGR the problem? I searched the forum but only seem to be seeing advice on sorting the bars, not specific to my situation.
J
- Mark as New
- Bookmark
- Subscribe
- Mute
- Subscribe to RSS Feed
- Permalink
- Report Inappropriate Content
I am not really sure I understand your description of the problem, do you think you can provide a sample to look at and the output you are expecting to see from it?
- Mark as New
- Bookmark
- Subscribe
- Mute
- Subscribe to RSS Feed
- Permalink
- Report Inappropriate Content
Hi Sunny
Thanks for taking a look. It is a bit confusing, maybe I should remove the post.
Essentially I had a stacked bar chart.
The STACK was the following formula: =if(Age('$(vEndDate)', dteDOB) < 18 , '< 18', if( Age('$(vEndDate)', dteDOB) < 30 , '18 - 29' , if( Age('$(vEndDate)', dteDOB) < 40 , '30 - 39' , if( Age('$(vEndDate)', dteDOB) < 50 , '40 - 49', if( Age('$(vEndDate)', dteDOB) < 60 , '50 - 59', if( Age('$(vEndDate)', dteDOB) < 65 , '60 - 65','65+'))))))
The BAR formula: AGGR(FirstSortedValue ( {< dteEffectiveDate = {"<$(vEndDate)"} >} txtCategoryName , - dteEffectiveDate ), MemberID )
The measure looked for Active Members.
My chart was a complete mess and didn't look right, turns out all that needed to change was the colour by. I was colouring just by txtCategoryName, hence the mess. Took me so long to realise.
The fix, colour by the full expression above for BAR.
Thanks again for responding!