Unlock a world of possibilities! Login now and discover the exclusive benefits awaiting you.
- Qlik Community
- :
- Forums
- :
- Analytics & AI
- :
- Products & Topics
- :
- Visualization and Usability
- :
- Week number or Quarter number
- Subscribe to RSS Feed
- Mark Topic as New
- Mark Topic as Read
- Float this Topic for Current User
- Bookmark
- Subscribe
- Mute
- Printer Friendly Page
- Mark as New
- Bookmark
- Subscribe
- Mute
- Subscribe to RSS Feed
- Permalink
- Report Inappropriate Content
Week number or Quarter number
Hi all,
I have a date from 2012 in my database. I have created a master calendar.
The week number and quarter is same for all the four years(2012,2013,2014,2015).
Example: January month of all the 4 years belongs to Quarter Q1. I don't need like this i need as jan-2012 in Q1, jan-2013 in Q5, jan-2014 in Q9, jan -2015 in Q13.
Because i need to show data in quarter for all the 3 years in line graph.
or anyone explain how can i achieve this?
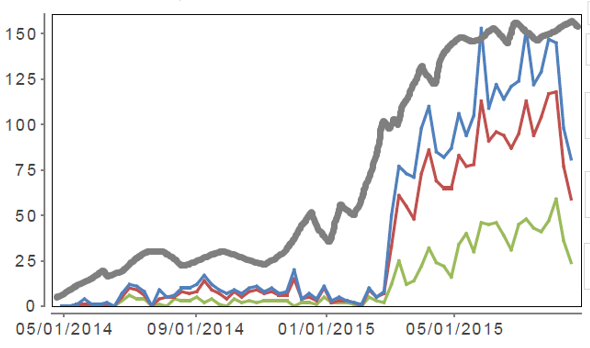
You can see in above image that the data is comparing for every four months i need to prepare a line graph like above.
Regards,
Pramod
- Tags:
- line graph
- « Previous Replies
-
- 1
- 2
- Next Replies »
- Mark as New
- Bookmark
- Subscribe
- Mute
- Subscribe to RSS Feed
- Permalink
- Report Inappropriate Content
cant help you further until I will get the fact table which you are using in excel file...
- Mark as New
- Bookmark
- Subscribe
- Mute
- Subscribe to RSS Feed
- Permalink
- Report Inappropriate Content
OK i will add excel, din't get what is fact table. i need to add all the tables what i have used?
- Mark as New
- Bookmark
- Subscribe
- Mute
- Subscribe to RSS Feed
- Permalink
- Report Inappropriate Content
OK... Add All tables in excel and upload here..
- Mark as New
- Bookmark
- Subscribe
- Mute
- Subscribe to RSS Feed
- Permalink
- Report Inappropriate Content
I think that's because the calendar table and the table with Month_Year are not linked properly.
Maybe all you need is adding a common key to the calendar:
- Calendar:
- Load
- *,
- 'Q'&AutoNumber(TempQuarter) as Quarter;
- Load
- Date(TempDate) as Date,
- Month(TempDate) as Month,
- Year(TempDate)& Num(Ceil(Month(TempDate)/3),'00') as TempQuarter,
- Date(Monthstart(TempDate),'MMM YYYY') as Month_Year,
- Year(TempDate) as Year
- Resident Temp_Calendar
- Order By TempDate;
- Mark as New
- Bookmark
- Subscribe
- Mute
- Subscribe to RSS Feed
- Permalink
- Report Inappropriate Content
please find the attached sample files.
- « Previous Replies
-
- 1
- 2
- Next Replies »