Unlock a world of possibilities! Login now and discover the exclusive benefits awaiting you.
- Qlik Community
- :
- Forums
- :
- Analytics & AI
- :
- Products & Topics
- :
- Visualization and Usability
- :
- Re: combine two dates field on one chart
- Subscribe to RSS Feed
- Mark Topic as New
- Mark Topic as Read
- Float this Topic for Current User
- Bookmark
- Subscribe
- Mute
- Printer Friendly Page
- Mark as New
- Bookmark
- Subscribe
- Mute
- Subscribe to RSS Feed
- Permalink
- Report Inappropriate Content
combine two dates field on one chart
Hi all,
I have a case where demand is seen for last 4 years and also the supply.
Demand or supply may vary for a particular day. There will be days where there is no demand or supply, or it could be that there is demand (no supply) /supply (no demand).
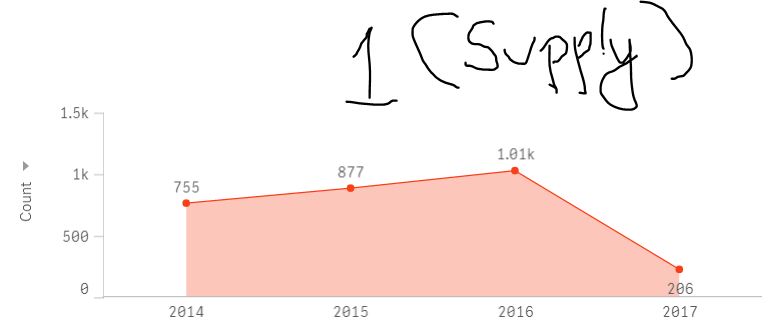
Like here we see from years (2014-2017) how a commodity is.
Dimension : Year(Supply Date field)
Measure: Count ( Supply Date field)
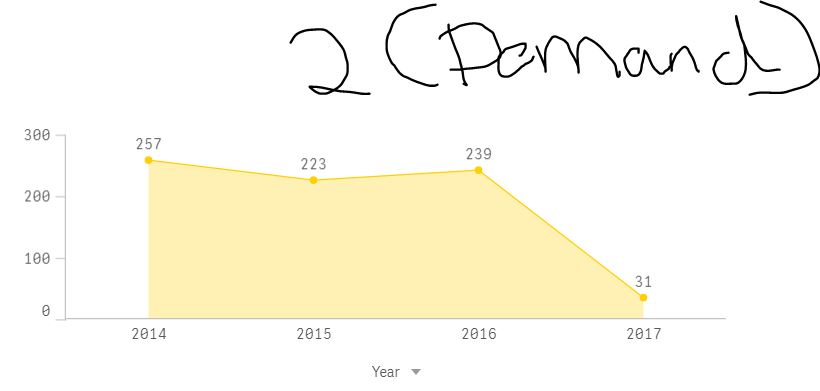
And here is the demand for the same commodity in last 4 years.
Dimension : Year(Demand Date field)
Measure: Count ( Demand Date field)
I want to combine this two charts to show on a common chart so that i can compare them one to other.
What would be the best way to do it ??
Let me know the best thoughts you have around this.
- « Previous Replies
-
- 1
- 2
- Next Replies »
Accepted Solutions
- Mark as New
- Bookmark
- Subscribe
- Mute
- Subscribe to RSS Feed
- Permalink
- Report Inappropriate Content
Hi everyone !!
I found an excellent way to solve this problem
Refer to : Canonical Date
This solved my problem.
- Mark as New
- Bookmark
- Subscribe
- Mute
- Subscribe to RSS Feed
- Permalink
- Report Inappropriate Content
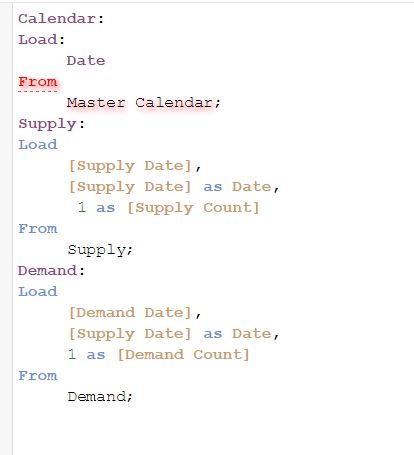
Create a calendar date and load like this
Calendar:
Load:
Date
From
Master Calendar;
Supply:
Load
[Supply Date],
[Supply Date] as Date,
1 as [Supply Count]
From
Supply;
Demand:
Load
[Demand Date],
[Supply Date] as Date,
1 as [Demand Count]
From
Demand;
Give dimension as Year(Date) and measures as sum([Supply Count]) and sum([Demand Count]) in a Line Chart
- Mark as New
- Bookmark
- Subscribe
- Mute
- Subscribe to RSS Feed
- Permalink
- Report Inappropriate Content
Load your data into a fact table that combines the two measures
Commodity
Fact Type -> supply / demand
Date
Value
Should let you compare your data how you want.
- Mark as New
- Bookmark
- Subscribe
- Mute
- Subscribe to RSS Feed
- Permalink
- Report Inappropriate Content
Thanks Aar kay for the reply
But I dont have any master Calender.
How should i create a calender Date?
- Mark as New
- Bookmark
- Subscribe
- Mute
- Subscribe to RSS Feed
- Permalink
- Report Inappropriate Content
Thanks Andy for your reply,
But still i dont understand whats a fact table.
How to create it ??
At the end i need a line chart showing the values.
- Mark as New
- Bookmark
- Subscribe
- Mute
- Subscribe to RSS Feed
- Permalink
- Report Inappropriate Content
Sample to create calendar dates
LET vStartDate = num(Floor(YearStart(Today(),-15))); //for min Date 1/1/2002
LET vEndDate = num(Floor(YearEnd(Today(),15))); // //for max Date 12/31/2032
LET vToday = num(Today());
LET vYesterday = num(Today()-1);
Calendar:
LOAD
$(vStartDate) + RowNo() - 1 AS Num,
date($(vStartDate) + RowNo() - 1) AS Date
AUTOGENERATE
$(vEndDate) - $(vStartDate) + 1;
- Mark as New
- Bookmark
- Subscribe
- Mute
- Subscribe to RSS Feed
- Permalink
- Report Inappropriate Content
So did you call this section in the script as Master calender??
When i try to do this in the script it did not identify the Master calender
- Mark as New
- Bookmark
- Subscribe
- Mute
- Subscribe to RSS Feed
- Permalink
- Report Inappropriate Content
I am getting error here. The date and master calender seems like is not identified.
- Mark as New
- Bookmark
- Subscribe
- Mute
- Subscribe to RSS Feed
- Permalink
- Report Inappropriate Content
I just gave you a sample code aman, try creating a calendar and load and link that date field to both the supply and demand dates that way there will be a common link to show the comparison on a graph.
Can you share the sample file
- Mark as New
- Bookmark
- Subscribe
- Mute
- Subscribe to RSS Feed
- Permalink
- Report Inappropriate Content
So here is the attached sample.
Consider Actual PR1 as Demand
and Actual PR3 as Supply.
Go to the Data script and you will see the error.
Let me know if you need anything else.
- « Previous Replies
-
- 1
- 2
- Next Replies »