Unlock a world of possibilities! Login now and discover the exclusive benefits awaiting you.

- Qlik Community
- :
- Forums
- :
- Analytics & AI
- :
- Products & Topics
- :
- Visualization and Usability
- :
- Re: total function
- Subscribe to RSS Feed
- Mark Topic as New
- Mark Topic as Read
- Float this Topic for Current User
- Bookmark
- Subscribe
- Mute
- Printer Friendly Page

 thewillemzelluf
- Mark as New
- Bookmark
- Subscribe
- Mute
- Subscribe to RSS Feed
- Permalink
- Report Inappropriate Content
total function
Hello everyone,
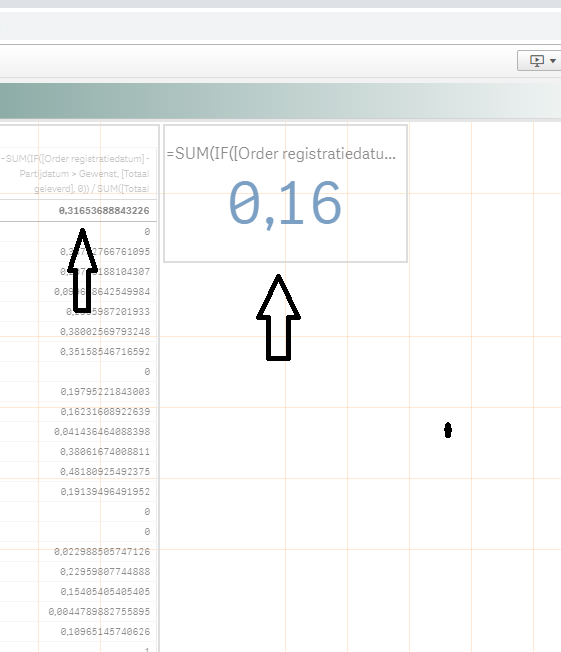
I have a question about the totals function. In the table (left in the image) the totals function is set to automatic. The sum of these amounts is 0.31653 ....
However, if I use the same calculation for the kpi graph, a different outcome will emerge. Any idea how I get the same result in both graphs?
The calculation used is:
=SUM(IF([Order registratiedatum] - Partijdatum > Gewenst, [Totaal geleverd], 0)) / SUM([Totaal geleverd])
Thanks in advance!
- Tags:
- total function
Accepted Solutions

 swuehl
- Mark as New
- Bookmark
- Subscribe
- Mute
- Subscribe to RSS Feed
- Permalink
- Report Inappropriate Content
Try a set expression that selects all possible values in your dimension field:
=SUM({<YourChartDimensionField = {"*"}>} IF([Order registratiedatum] - Partijdatum > Gewenst, [Totaal geleverd], 0))
/ SUM({<YourChartDimensionField = {"*"}>} [Totaal geleverd])
swuehl
- Mark as New
- Bookmark
- Subscribe
- Mute
- Subscribe to RSS Feed
- Permalink
- Report Inappropriate Content
Does your dimension(s) in your chart show NULL in some of the records?
edit:
What if you make an active selection of all possible values in your dimension field? Do both charts show the same total now?
thewillemzelluf
- Mark as New
- Bookmark
- Subscribe
- Mute
- Subscribe to RSS Feed
- Permalink
- Report Inappropriate Content
oh i see it, when i include null values i get the same value. any idea how to exclude null values in my KPI chart?
swuehl
- Mark as New
- Bookmark
- Subscribe
- Mute
- Subscribe to RSS Feed
- Permalink
- Report Inappropriate Content
Try a set expression that selects all possible values in your dimension field:
=SUM({<YourChartDimensionField = {"*"}>} IF([Order registratiedatum] - Partijdatum > Gewenst, [Totaal geleverd], 0))
/ SUM({<YourChartDimensionField = {"*"}>} [Totaal geleverd])
thewillemzelluf
- Mark as New
- Bookmark
- Subscribe
- Mute
- Subscribe to RSS Feed
- Permalink
- Report Inappropriate Content
thankyou! it did work out!
