Unlock a world of possibilities! Login now and discover the exclusive benefits awaiting you.
- Qlik Community
- :
- Discover
- :
- About
- :
- Water Cooler
- :
- Re: value in the bar and sum on the bar
- Subscribe to RSS Feed
- Mark Topic as New
- Mark Topic as Read
- Float this Topic for Current User
- Bookmark
- Subscribe
- Mute
- Printer Friendly Page
- Mark as New
- Bookmark
- Subscribe
- Mute
- Subscribe to RSS Feed
- Permalink
- Report Inappropriate Content
value in the bar and sum on the bar
Hi all
I have this chart:

Is it possibile having the sum above every bar?
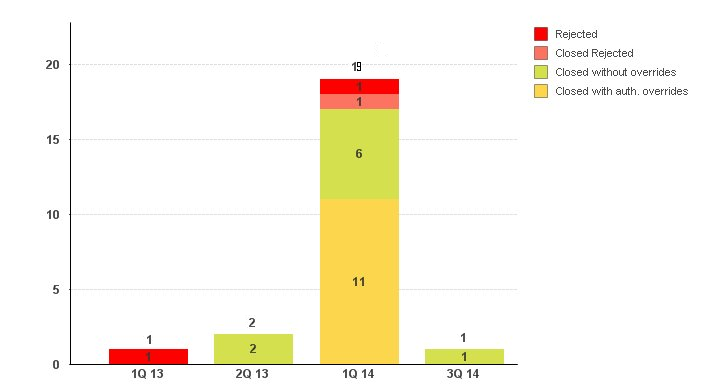
thanks in advance
Luca
- « Previous Replies
-
- 1
- 2
- Next Replies »
Accepted Solutions
- Mark as New
- Bookmark
- Subscribe
- Mute
- Subscribe to RSS Feed
- Permalink
- Report Inappropriate Content
Not in one chart, but you can get the totals below the bars. See attached example.
talk is cheap, supply exceeds demand
- Mark as New
- Bookmark
- Subscribe
- Mute
- Subscribe to RSS Feed
- Permalink
- Report Inappropriate Content
I do not think so since you have plot inside segments checked (can't have both), but you can put on axis by adding another expression and calculating the total that way, just check Text on Axis and Uncheck Bar chart:
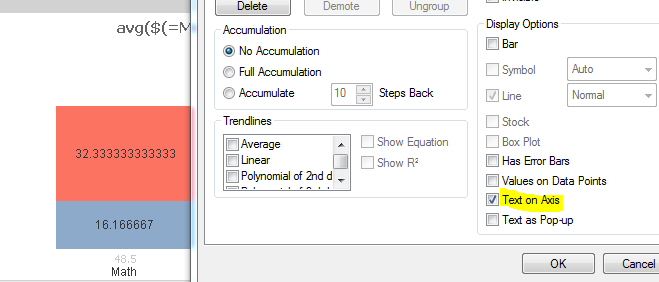
Hope this helps!
- Mark as New
- Bookmark
- Subscribe
- Mute
- Subscribe to RSS Feed
- Permalink
- Report Inappropriate Content
Hi,
You can add an other expression like :
Column(1)+Colunm(2)+Column(3)+Colunm(4)
and on the Display Options panel
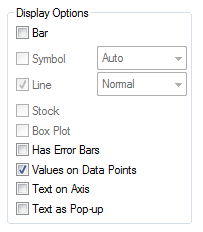
uncheck Bar and check Values on Data Points
Best,
Aurélien
- Mark as New
- Bookmark
- Subscribe
- Mute
- Subscribe to RSS Feed
- Permalink
- Report Inappropriate Content
Not in one chart, but you can get the totals below the bars. See attached example.
talk is cheap, supply exceeds demand
- Mark as New
- Bookmark
- Subscribe
- Mute
- Subscribe to RSS Feed
- Permalink
- Report Inappropriate Content
If you want to put the values on the datapoint then
Right Click on graph--> Properties-->Expression-->Check field Values on data point. It will display data above the graphs.
- Mark as New
- Bookmark
- Subscribe
- Mute
- Subscribe to RSS Feed
- Permalink
- Report Inappropriate Content
thanks.
how I write the expression? could you post an axample?
luca
- Mark as New
- Bookmark
- Subscribe
- Mute
- Subscribe to RSS Feed
- Permalink
- Report Inappropriate Content
The expression would be the total of each of the 4 segments for your bar. Just add them together or sum them up, depends on your expression(s) for getting those numbers. How are you calculating now?
Hope this helps!
- Mark as New
- Bookmark
- Subscribe
- Mute
- Subscribe to RSS Feed
- Permalink
- Report Inappropriate Content
in my chart, X-dimension is
=Pick( Match (left( Text(QuarterName([Ingresso Contract Analysis])),1), 'g','a','l','o'), '1Q ','2Q ','3Q ','4Q ') & right(Text (QuarterName([Ingresso Contract Analysis])),2)
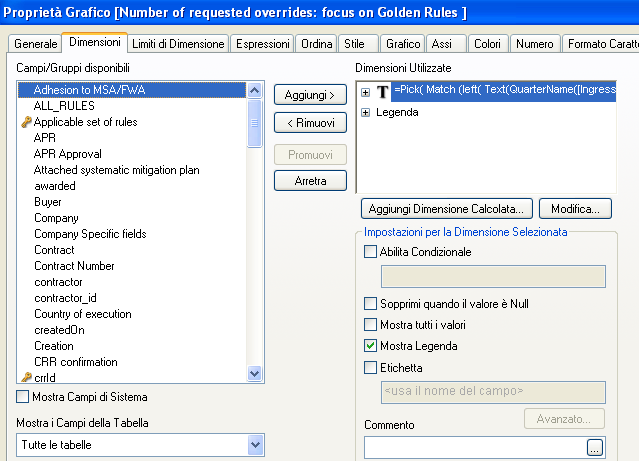
how can I use this in a expression like "count(total <Month> Sales)" ?
luca
- Mark as New
- Bookmark
- Subscribe
- Mute
- Subscribe to RSS Feed
- Permalink
- Report Inappropriate Content
Well, you can't. The sane way out of this is to create the quarter field in the script and then use it as dimension in your chart instead of that calculated dimension you have now. You can simply reuse the expression of your calculated dimension in the script to create that quarter field in the same table you load the field [Ingresso Contract Analysis].
talk is cheap, supply exceeds demand
- Mark as New
- Bookmark
- Subscribe
- Mute
- Subscribe to RSS Feed
- Permalink
- Report Inappropriate Content
ok, thank you very much..
luca
- « Previous Replies
-
- 1
- 2
- Next Replies »