Unlock a world of possibilities! Login now and discover the exclusive benefits awaiting you.
Qlik Community
Qlik Community is the global online community for Qlik employees, experts, customers, partners, developers and evangelists to collaborate.
- Qlik Community
- :
- popularResources
popularResources
Below script helps in loading all the tables in the database and store that tables in QVDs.
ODBC CONNECT TO MyODBC;
SQLTableList:
LOAD "TABLE_NAME" as TableNames;
SQL SELECT DISTINCT "TABLE_NAME"
FROM "INFORMATION_SCHEMA".COLUMNS;
Note:
Information schema
...Below script helps in loading all the tables in the database and store that tables in QVDs.
ODBC CONNECT TO MyODBC;
SQLTableList:
LOAD "TABLE_NAME" as TableNames;
SQL SELECT DISTINCT "TABLE_NAME"
FROM "INFORMATION_SCHEMA".COLUMNS;
Note:
Information schema.columns is for MS SQL Server database, you can replace that with the euqivalent table in the corresponding database.
For oracle ALL_TABLES ALL_TABLES
For MYSQL - all_tables or SHOW_TABLES
How to List All Tables and Describe Tables in Oracle, MySQL, DB2 and PostgreSQL | OneWebSQL
MySQL :: MySQL 5.7 Reference Manual :: 13.7.5.37 SHOW TABLES Syntax
Let vTableCount = NoOfRows('SQLTableList');
Let vTableCountQVD = 'dbo.[' & NoOfRows('SQLTableList') & ']';
For i = 0 To $(vTableCount) -1
LET vMyTableName = 'dbo.[' & Peek('TableNames', $(i), 'SQLTableList') & ']';
LET vMyTableNameQVD = Replace(Peek('TableNames', $(i), 'SQLTableList'), ' ', '');
$(vMyTableNameQVD):
SQL SELECT *FROM $(vMyTableName);
STORE $(vMyTableNameQVD) INTO $(ExtractQVD)$(vMyTableNameQVD).QVD;
DROP Table $(vMyTableNameQVD);
Next i
Hope this helps others.
Regards,
Jagan.
- Labels:
-
Scripting
When we want to do something with QlikView, we face so many possibilities to achive the goal. And sometimes, the first idea we have is not necessarily the simplest one.
I wanted to do create YTD and moving totals measures, difference (absolute and in
...
When we want to do something with QlikView, we face so many possibilities to achive the goal. And sometimes, the first idea we have is not necessarily the simplest one.
I wanted to do create YTD and moving totals measures, difference (absolute and in percentage) of these moving totals versus the Year ago. QlikView is a BI tool: no problem I thought. Well, it was not so simple ...  The expressions became so complex that I finally did not understand them any more!
After some searches and many tries,the solution to such a chart is very simple. You just need to look at the right place.
As you can see, this chart contains actual data and the one of the year ago, a YTD starting in January and the same for the Year Ago, Rolling 3 and 12 periods and the same for the Year Ago. These values are contained in a TIME ANALYSIS axis that the user can select in a simple List Box to display only YTD and Rolling12 for example:
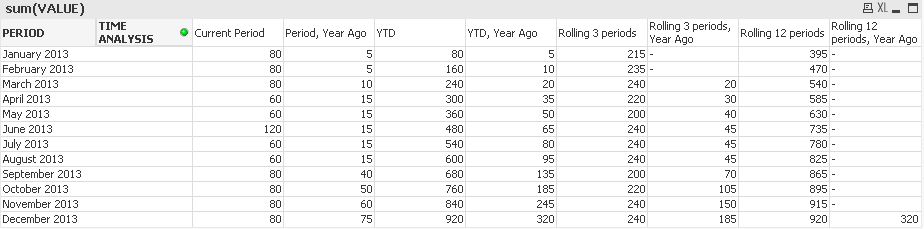
The document will help you to understand the modification you have to do to your data model to make this report very simple. As you can already see, the expression is the simplest expression in QlikView: sum(VALUE).
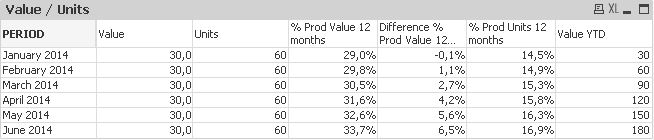
This simplicity let you afterwards mix the different measures of the database with this TIME ANALYSIS axis : get the current sales values, but the share the products represents the last 12 motnhs, and a difference vs year ago:
Many thanks to G. Wassenaar and his post that helped me to understand where to look exactly : http://community.qlik.com/docs/DOC-4252
Have a nice reading
Fabrice AUNEZ
I have attached sample QVW and Sample data. Hope this will be helpful for all..
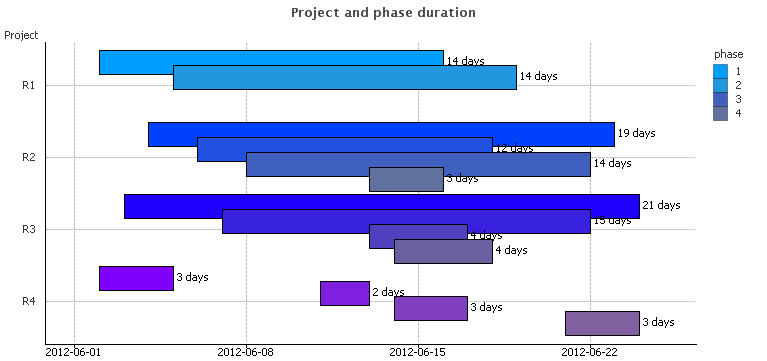
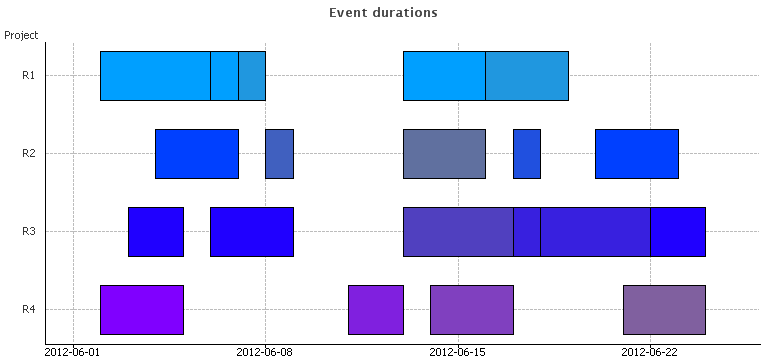
Have you ever wanted to create a Gantt chart in QlikView, only to find out that this chart type is not one of the pre-defined charts? Then you should be happy to learn that it is possible to create a Gantt chart and that it is not very difficult. See
...Have you ever wanted to create a Gantt chart in QlikView, only to find out that this chart type is not one of the pre-defined charts? Then you should be happy to learn that it is possible to create a Gantt chart and that it is not very difficult. See more on Recipe for Gantt chart.
- Labels:
-
Creating Analytics
This page will collect all relevant release information about Power Tools for QlikView, and will be continuously updated with each new release and with any patches that are issued. This way we hope for a more consolidated view of the Power Tools suit
...This page will collect all relevant release information about Power Tools for QlikView, and will be continuously updated with each new release and with any patches that are issued. This way we hope for a more consolidated view of the Power Tools suite.
Do you have a feature request or a bug?
- Start a discussion in the QlikView Management or Deployment forums, or
- Email sbn@qlik.com
Latest release
Power Tools 1.3.2 for QlikView
Power Tools 1.3.2 for QlikView - Release Notes
Power Tools 1.3.2 for QlikView - Readme
QlikView 12 compatibility matrix
| 12.0 | 12.1 | 12.2 | |
| QlikView Server Agent | Yes | Yes | Yes |
| QlikView Server Super Agent | Yes | Yes | Yes |
| QMSClient | Yes | Yes | Yes |
| Qv User Manager 10 | Not yet | Not yet | Not yet |
| Qv User Manager 11 | Not yet | Not yet | Not yet |
| QvsDetector | Yes | Yes | Yes |
| QvServerObjectConnector | Not yet | Not yet | Not yet |
| ReloadScheduleMigration | No | No | No |
| ServerObjectHandler | Yes | Yes | Yes |
| ServerObjectHandlerBatch | Yes | Yes | Yes |
| SharedFileRepair | Not yet | Not yet | Not yet |
| SharedFileViewer | Not yet | Not yet | Not yet |
| XMLDBViewer | Yes | Yes | Yes |
Please note that this matrix only describes the compatibility with QlikView 12. It does not indicate whether or not Power Tools are officially supported, because they are not.
SharedFileViewer
Provides insight into the QlikView Server .shared files belonging to .qvw documents. The .shared file stores server data such as server/shared bookmarks, server objects (charts and objects created by a client via the server), annotations and other data that is specific to the document. The tool visualizes the content of the binary .shared file and provides options to "Repair" legacy files, as well as defrag large .shared files.
QvServerObjectConnector
A custom data connector for QlikView that much like the SharedFileViewer provides insight into .shared files, but instead allows to load data straight from .shared files into QlikView documents for analysis. The tool supports extraction of data like ownership, size and type of objects, expressions, annotations, bookmark selections (fields and values) and much more.
QlikView Server Agent
A small service utility that allows easy management of QlikView services. Also allows for quick change of credentials across multiple services at the same time.
QlikView Server Super Agent
A monitoring tool for QlikView Server, that monitors Qv services regardless of version (9+) and reports any service outage with email notifications and/or log files.
QMS API Client
A highly useful tool that gives its user the possibility to interact with the complete setup of QMS API functions in QlikView Server without typing a line of code. Visualizes data structures and enables the user to parameterize and test every function call based on their own data or data from the QMS API.
Qv User Manager
A command-line tool to list, add, remove and edit CAL and user information in a QlikView Server remotely.
QvsDetector
Scans the current subnet for other QlikView Servers and visualizes information like license, root folder, version and such. Also enables certain administrative functions.
Reload Schedule Migration Tool
A small step-by-step instruction tool that helps migrate reload schedules from non-Publisher databases in 9 to Publisher databases in 10 or 11, by manipulating the QVPR database (XML repository required) directly.
Server Object Handler
Enables listing, ownership changing and deletion of server objects in documents hosted on a QlikView Server remotely. Also allows ownership changing to be performed on a selected number of server objects matching a given name pattern.
Server Object Handler Batch
The command-line little brother of the Server Object Handler, that does all the same, but from any command prompt or batch script.
XmlDbViewer
Visualizes and enables searching in and editing of the QlikView Publisher Repository database (QVPR), when in XML format.
Shared File Repair
Uses the upgraded .shared file verify and repair functionality that was re-introduced in QlikView Server (QVS.exe) SR5, by providing a GUI to execute verify/repair operations on one or more .shared files and report the result. Note that even though the verify/repair functionality first came into QVS in 11.20 SR4, this version requires the upgraded functionality in 11.20 SR5.
Frequently Asked Questions
Q: What is a Power Tool?
A: A Power Tool is a small utility program or application that aid in performing a specific functionality or that extends QlikView functionality in some other way.
Q: When should I use a Power Tool?
A: Power Tools should be used when there is a need for functionality that is not in the QlikView product suite already, to evaluate new functionality or when administrative actions outside that is not available as part of the regular program suite might be needed.
Q: Do I need to install any of the tools?
A: No, all tools are, as of this moment, drop-to-deploy tools. Be aware that some of them require resource files outside of the executable itself, like for example configuration files or DLL files. When deploying, make sure to deploy the whole folder and its content.
Q: Do the tools require administrative privileges?
A: Some of them require this, yes. It is up to each tool and its functionality. If you are using UAC (User Account Control) security, make sure to run the tools in privileged mode (right-click and select “Run as Administrator”).
Q: Is there any documentation for the Power Tools?
A: Yes. A limited documentation for the Power Tools is included in each of the separate tools.
Q: Are the Power Tools Supported?
A: No. The Power Tools are not supported and is seen as use-as-is tools, supplied separate from the QlikView product suite. *** Qlik is not responsible for any consequences such as environmental issues, data corruption, configuration errors or unexpected behavior, resulting from the use of Power Tools. ***
Q: Where do I report bugs in the Power Tools?
A: To report a bug, please visit our QlikCommunity Discussion Forums, for example the QlikView Management or QlikView Deploymentforums or send an email to SupportServiceabilityLabs@qlik.com. Bugs will be fixed between releases of the Power Tools entirely at Qlik's discretion.
Older versions
Power Tools 1.3.1
Power Tools 1.3.1 for QlikView
Power Tools 1.3.1 for QlikView - Release Notes
Power Tools 1.3.1 for QlikView - Readme
Power Tools 1.3.0
Power Tools 1.3.0 for QlikView
Power Tools 1.3.0 for QlikView - Release Notes
Power Tools 1.3.0 for QlikView - Readme
Power Tools 1.2
Power Tools 1.2 for QlikView - Release Notes
Power Tools 1.2 for QlikView - Readme
Power Tools 1.1
Power Tools 1.1 for QlikView - Release Notes
Power Tools 1.1 for QlikView - Readme
Power Tools 1.0
- Labels:
-
Deployment
-
Developer Toolkit
-
Management
Introduction
This document is part of a series of documents that discuss how to get started with using the QlikView Management API and provides a number of examples.
The QlikView Management API is a web service against which you can issue a range of co
...Introduction
This document is part of a series of documents that discuss how to get started with using the QlikView Management API and provides a number of examples.
The QlikView Management API is a web service against which you can issue a range of commands to automate management activities on a QlikView environment. These activities can include the following:
- Creating new document tasks
- Modifying permissions
- Viewing updating licences
- Modifying server settings
To use the QMS API you need to be familiar with working with web services an writing code however the examples here cover many common tasks which avoid the need for detailed coding skills. All of the examples provided in these pages are written using Visual Studio with .net and C#. Other languages can be used and the free versions of Visual Studio can be used also.
Getting Started
Before you begin using the API or using the examples you need to be familiar with out to set up Visual Studio for using the APIs web service. You can find this information here:
QlikView Management API - #1 Setting up a Visual Studio project
In addition the official project documentation can be found here on the QlikView SDK pages here:
Examples
Below are links to a number of community documents with examples of using the API for particular tasks. All of the examples are built on top of the Getting Started project provided above but the code is easy to port to other applications.
- #1 Setting up a Visual Studio project
- #2 Export / Add / Delete Document CALs
- #3 Export / Add / Delete Named CALs
Coming soon
- Creating and running Document Tasks
- Creating document triggers
- Applying server licenses
- Labels:
-
QlikView Publisher
Useful connectivity documentation from QlikView to Oracle Databases
Useful connectivity documentation from QlikView to Oracle Databases
Introduction
This document is part of a series of documents that discuss how to use the QlikView Management API. You can find the index for these documents Here.
The Management API is a web service against which you can issue a range of commands to aut
...Introduction
This document is part of a series of documents that discuss how to use the QlikView Management API. You can find the index for these documents Here.
The Management API is a web service against which you can issue a range of commands to automate management activities on a QlikView environment. There are a couple of prerequisite set up items to do before you can use it and the web service has to be used in a particular way. This document describes how you can configure a Visual Studio project to work with the web service.
An example starter Visual Studio project pre-configured to use the API is attached to this document. The free versions of Visual Studio can be used although some of the screens described below may be slightly different.
Using the API
Step 1 – Set Permissions
To be able to make calls to the management service the request needs to come from a user context with membership of a specific group on the QlikView server. For most API calls the user needs to be a member of the “QlikView Management API” group, this groups is not created by the QlikView installer and so must be created and the relevant users added.
Depending on the type of application you are building you need to use an appropriate way of running the code as a particular user. For example:
- If you have a desktop application, it can run using the login ID of the current user
- If you have a web page then either the user ID of the web site OR the user ID of the person browsing can used
- If you always want a specific user to be used to call commands you can embed this into the code
Further discussion of this subject can be found HERE (TBC)
Step 2 – Create a project & Reference the QlikView Management Web Service
Open Visual Studio and start a new project for the type of solution you want to use. For the example and instructions provided it is a basic console application but the process works the same for asp.net, WinForms etc.
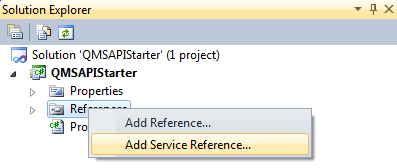
The first step is to connect the QMS API to visual studio by adding a Service Reference
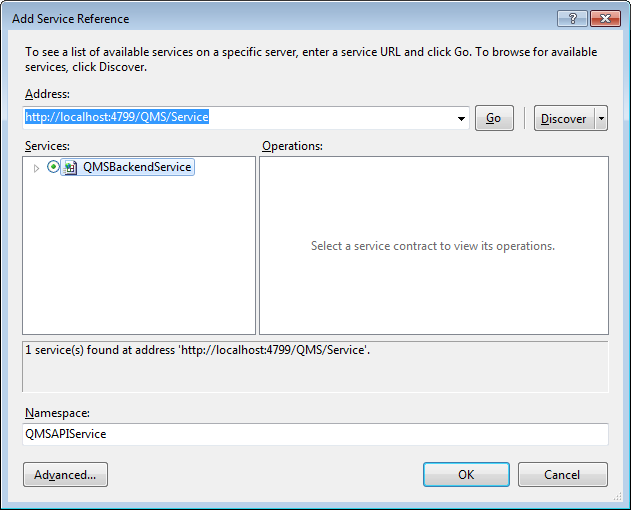
Into the service reference dialogue enter the following URL adjusting for your particular QlikView server address - http://localhost:4799/QMS/Service - click the Go button and it will connect and validate that the service exists. Provide a meaningful name for this reference, for example QMSAPIService. It should look as below
Step 2 – Configure Visual Studio to use a Service Behaviour
The QMS web service requires the presence of a HTTP header containing a “service key” representing your user session with the server. This must be injected into every request and while this is a fairly complex thing to do, QlikView provides the code required to do this in .net projects.
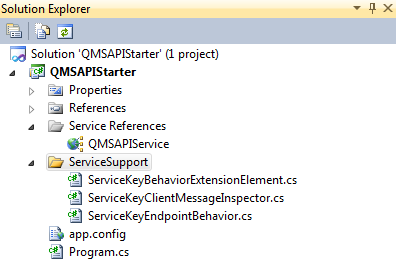
Firstly in Visual Studio create a new folder called ServiceSupport in the root of the projects folder structure.
Download the attached "ServiceSupportFiles.zip" file and extract the 3 files starting with “ServiceKey…cs”. Now right click the folder the folder you created above and click “Add | Existing Item” browse to where you saved the files, select all 3 and click Add. The structure of your project should now look like the below.
Next each of these three files needs to have its namespace edited to match the namespace of your entire project. So open each file and locate the line that will look like this
namespace QMSAPIStarter.ServiceSupport
The namespace of your project will match the name of the project if you didn’t change it and in the above case the text you would change is QMSAPIStarter, leave the ServiceSupport part present
Next open web.config or app.config depending on the type of project you have. Locate the opening tag called <system.serviceModel> and immediately after this paste the below entry
<extensions>
<behaviorExtensions>
<add name="serviceKeyBehavior" type="QMSAPIStarter.ServiceSupport.ServiceKeyBehaviorExtensionElement, QMSAPIStarter, Version=1.0.0.0, Culture=neutral, PublicKeyToken=null"/>
</behaviorExtensions>
</extensions>
<behaviors>
<endpointBehaviors>
<behavior name="ServiceKeyEndpointBehavior">
<serviceKeyBehavior/>
</behavior>
</endpointBehaviors>
</behaviors>
Notice in the code there are TWO references to the namespace for the code we added above, make sure BOTH of these match the namespace of your project.
Finally locate the following block in the config file
<endpoint address="http://localhost:4799/QMS/Service" binding="basicHttpBinding"
bindingConfiguration="BasicHttpBinding_IQMS" contract="QMSAPIService.IQMS"
name="BasicHttpBinding_IQMS" />
Before the closing tag add behaviorConfiguration="ServiceKeyEndpointBehavior"
Save and close the config file.
Step 3 – Create an object to communicate with the API and add the Service Key
The next step is to write the first piece of code to communicate with the web service, handle the service key and from then on the API functions can be used.
Create the item you want to work with, in this example I am creating a simple class and writing code into the Main method, if you are working with a web page you can locate the code, on load or on the click of a button.
At the top of your code page add the following statements to reference the support functions and the API itself (correct namespace accordingly):
using QMSAPIStarter.QMSAPIService;
using QMSAPIStarter.ServiceSupport;
Now into the function you are using paste the below code. This creates the “QMSClient” object from which all subsequent API calls will be made, and packages the service key required to use it. Here i have hard coded the URL to QMS Web Service if you leave it out it will pick up the URL from your config file.
QMSClient Client;
string QMS = "http://localhost:4799/QMS/Service";
Client = new QMSClient("BasicHttpBinding_IQMS", QMS);
string key = Client.GetTimeLimitedServiceKey();
ServiceKeyClientMessageInspector.ServiceKey = key;
The ServiceKey is the token that represents your session with the API. Once the token is obtained it is valid for 20 minutes however this period is extended after each call to the API so you should only need to request a key once.
Step 4 – Issue an API command
Now it is possible to issue commands against the API. Below is a simple function that will ask for the list of services on the QlikView server and print out their names.
ServiceInfo[] myServices = Client.GetServices(ServiceTypes.All);
foreach (ServiceInfo service in myServices)
{
Console.WriteLine(service.Name);
}
Build your project and execute it to see the results. You can now build and run your own applications using the API.
There are a number of objects, types and methods included in the API - Check out the list of examples to see how they can use - see Here
- Labels:
-
QlikView Publisher
There are many documents and notes which talk about Set Analysis, but until the moment I started to write this manual I didn´t find any in Spanish, so I decided to write it.
Most of it is based on translated adaptations of previous works that I found
There are many documents and notes which talk about Set Analysis, but until the moment I started to write this manual I didn´t find any in Spanish, so I decided to write it.
Most of it is based on translated adaptations of previous works that I found in the community, to which I have added my own examples that I have been finding over the years. On the last page you will find the references.
This is a first version that will improve with your comments, corrections and contributions.
I hope you find it useful.
-----------------------------------------------------------------------------------------------------------------------------------------------------------------------------
Son muchos los documentos y notas que hablan de los análisis de conjuntos (Set Analysis), pero hasta el momento de comenzar a redactar este manual no encontré ninguno en Español, así que me decidí a escribirlo.
La mayor parte está basado en adaptaciones traducidas de trabajos previos que encontré en la community, a los que he añadido ejemplos de cosecha propia que me he ido encontrando a lo largo de los años. En la última página encontraréis las referencias.
Esta es una primera versión que iré mejorando con vuestros comentarios, correcciones y aportaciones.
Espero que os sea de utilidad.
------------------------------------------------------------------------------------------------------------------------------------------------------------------------------
Special thanks to Henric Cronstöm who encouraged me to write it when I was part of the spanish Qlik consulting team.
This technical brief explains the Bundle Load function in QlikView. The files contained in this zip file are the technical brief, a QVW, and the supporting data and image files. I wrote a blog about this topic and you can view it here.
This technical brief explains the Bundle Load function in QlikView. The files contained in this zip file are the technical brief, a QVW, and the supporting data and image files. I wrote a blog about this topic and you can view it here.
- Labels:
-
Creating Analytics
In this post, I will demonstrate how to programmatically select multiple values in a field.
We know that manually, we can select multiple field values by pressing down on the Ctrl button and selecting the values in the field one at a time.
Screenshot o
In this post, I will demonstrate how to programmatically select multiple values in a field.
We know that manually, we can select multiple field values by pressing down on the Ctrl button and selecting the values in the field one at a time.
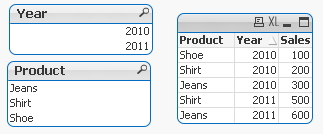
Screenshot of two values selected in the Year field:
There may be times when you have a requirement to pre-select multiple values programmatically, for example the current and previous months need to be selected when the document is opened.
Selecting multiple field values can be done through Actions.
The following steps illustrate how to add an Action to select 2013 and 2014 values in the Year field for a button (Actions can be added to other objects, such as the Sheet, Document, etc.):
- Go to the Properties of the button object
- Navigate to the Actions tab and add a new Action
- Choose the Selection for Action Type and choose Select in Field for Action
- In the Field textbox, enter the field name, in this example Year
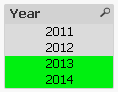
- In the Search String textbox, enter the values to be selected, separated by the vertical bar | and enclosed in parentheses (), in this example (2013|2014)
The following screenshot illustrates the values 2013 and 2014 for the Year field:
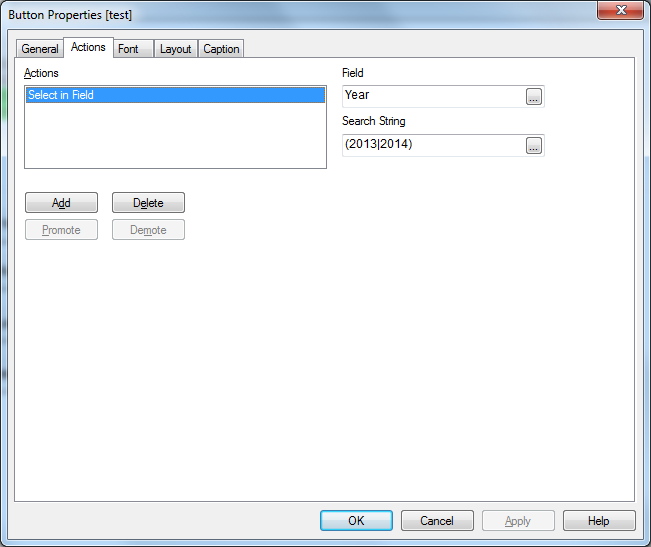
When you press on the button, both 2013 and 2014 values should be selected together in the Year field.
Using Expressions:
The search string can also take expressions using the following syntax:
='(' & Expression1 & '|' & Expression2 & ')'
An example of using an expression to determine last and next month from today’s month:
='(' & Month(AddMonths(Date(Today()), -1)) & '|' & Month(AddMonths(Date(Today()), +1)) & ')'
An example of using variables for current and previous months:
='(' & $(vCurrentMonth) & '|' & $(vPreviousMonth) & ')'
Sample Application:
This post includes a sample application that illustrates a few options for selecting multiple values in a field.
Hope this post was helpful to you.
- Labels:
-
App Development
-
New to QlikView
Hello,
This requirement has come up again and again and believe would keep coming up in QlikView/Qlik Sense development. Fortunately there are already some solutions been discussed and documented here in the community, like: Ignore all selections except some specific fields using Set Analysis
...Hello,
This requirement has come up again and again and believe would keep coming up in QlikView/Qlik Sense development. Fortunately there are already some solutions been discussed and documented here in the community, like: Ignore all selections except some specific fields using Set Analysis which is very helpful. Somewhere, we people are tempted to find an easier work around if not a better solution.
Some of us tempt to use p() like: Sum({1<Field1=p(Field1)>} Amount)
expecting getting all amounts irrespective of all selections except Field1. However, this could lead to an unwanted output. Since, p(Field1), i.e. - possible values of Field1 could change with other selections, the output could get affected by other fields selections.
Let me explain with a case. Say I have a simple sales table like:
With this, I want ignore all selections except Product. So I try with:
Sum({1<Product=p(Product)>}Sales)
When there is no selection I get as expected :1700
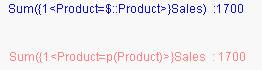
But what happens, if I select Year=2011 ? The value changes (see, below) which we never expected
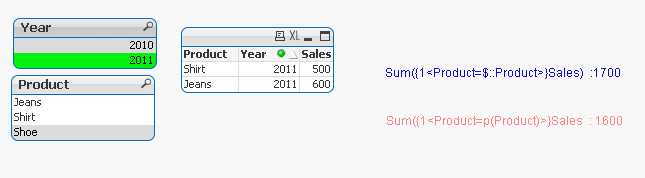
Explanation: When I select Year=2011, the p(Product) returns possible values as Shirt and Jeans, and disregarding year selection, Shirt and Jeans overall Sales comes 500+600+200+300=1600. I.e. though the Year selection doesn't affect directly, but has reduced the possible values of Product.
However, the alternate solution I proposed - Sum({1<Product=$::Product>} Sales) works fine, because that is not related to possible values , rather the direct selection.
This came up while I was trying to help with a similar requirement here :Set Analysis
And yes, the credit goes to Simen Kind bwisenosimenkg
I have attached the worked out qvw as well. Hope this helps.
- Tags:
- qlikview
- selection
- set analysys
- Labels:
-
App Development
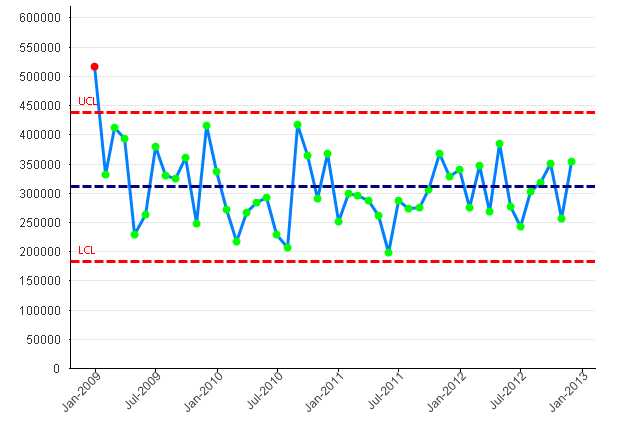
What is Control Chart?
The control chart is a statistical analysis used to study how a process changes over time. Data are plotted in time order. Control charts are used to routinely monitor quality or simply you can say, control chart is process impr
...What is Control Chart?
The control chart is a statistical analysis used to study how a process changes over time. Data are plotted in time order. Control charts are used to routinely monitor quality or simply you can say, control chart is process improvement technique.
What is a process?
A process is simply what we do. It can be filling out an expense report, checking a person into a hospital, burning a CD with music, driving to work, filling a prescription, etc. All these process generates the data. We take these generated data and plot on control chart to improve efficiency.
There are many types of control chart, but we are going to use the basic control chart with Std dev method to understand the concept.
Followings are some scenario where we can use the control chart
1) In manufacturing to test if machinery are producing products within specifications.
2) suppose you want to reduce the time it takes to admit someone to the hospital.
3) If you want to know how views are going up or down for particular website.
Components of Control Chat
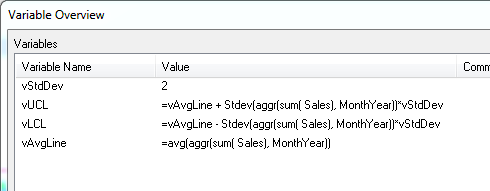
1) Avg line
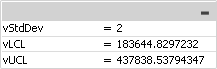
2) UCL (Upper Control line) = Avg Value + Std Deviation* Std Dev Multiplier
3) LCL (Lower control line) = Avg Value - Std Deviation* Std Dev Multiplier
So, basically we can see which are the points "Out of Control" or "In Control".
You can control your Std Dev multiplier using variable.
How to create the Control Chart.
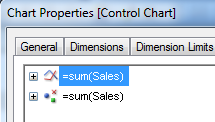
1) Create the Combo Chart.
2) Take any Time dimension of your interest which is suited for your analysis, here I have taken the MonthYear. Also make it Continuous in Axis setting
3) Create two Expression, one for Line and second for Symbol.
4) Create expressions for Avg line, UCL & LCL which will be used as reference lines in the chart. Check the Chart properties ->Presentation for reference line setting.
5) Create the Background color setting for Symbol expression
if( sum(Sales) < vUCL and sum(Sales) > vLCL, LightGreen(), LightRed())
6) Finally the chart will look like below
There are some other useful links available to create the control charts
See also :
- Tags:
- qlikview
El documento adjunto es el apoyo a la charla que me pidió el Qlik User Group Iberia para su reunión del primer aniversario.
Se trata de un compendio de buenas prácticas de Scripting y está dividido en 5 partes:
- Qlik Deployment Framework
- Arquitectura en
El documento adjunto es el apoyo a la charla que me pidió el Qlik User Group Iberia para su reunión del primer aniversario.
Se trata de un compendio de buenas prácticas de Scripting y está dividido en 5 partes:
- Qlik Deployment Framework
- Arquitectura en 3 capas
- Buenas prácticas enfocadas a la Mejora del Rendimiento
- Buenas prácticas enfocadas a Facilitar el Mantenimiento
- Buenas prácticas en scripting para Incrementar la Velocidad de Desarrollo en la fase de diseño.
El nº de diapositivas está adaptado al limitado tiempo de exposición, por lo que es posible que echéis muchas cosas en falta, aunque trata de cubrir los mínimos esenciales.
La mayoría de las recomendaciones son aplicables tanto a QlikView como a Qlik Sense.
Sentíos libres para hacer cualquier comentario o sugerencia que estiméis oportuno y por supuesto para descargarlo y usarlo como guía en vuestras empresas.
Que lo disfrutéis.
- Tags:
- qlikview
Hello
One reason why you want to use dollar sign expansion is the possibility to store your expressions in variables and then use these variables in your chart expressions. THis will concentrate all business logic in one place and simplify chart expre
...Hello
One reason why you want to use dollar sign expansion is the possibility to store your expressions in variables and then use these variables in your chart expressions. THis will concentrate all business logic in one place and simplify chart expressions. But suppose you want to pass some parameters into these expressions. QlikView supports this, but there is very annoying problem. If there are any commas (,) in your parameter value, QlikView treats this as parameter separator but not as part of parameter value.
Recently I found some workaround for that. Suppose we have and expression stored in a variable varExpr. The value o expression is SUM({$< $1 >} quantity).
Now if I create a chart expression =$(varExpr(year)), this will convert into =SUM({$< year>} quantity) and it will calculate sum ofd quantity field with year field cleared. But what if I want to clear not just year field but month as well. I cannot do this by setting my chart expression to =$(varExpr(year, month)) this will not work and as a result I get the same expression =SUM({$< year>} quantity).
But If I use SUM({$< $(=REPLACE('$1', ';', ',')) >} quantity) for variable value and then =$(varExpr(year; month)) for chart expression - this will give me the expression I want =SUM({$<year, month>} quantity).
Cheers
Darius.
- Tags:
- $expansion
- app_development
- quote
- Labels:
-
App Development
Hello Everyone,
I have attached the document for the important Qlikview functions used in script as well as in UI.
Please have a look and also feel free to update the document or comment in the session for the functions which is missed.
Hello Everyone,
I have attached the document for the important Qlikview functions used in script as well as in UI.
Please have a look and also feel free to update the document or comment in the session for the functions which is missed.
- Labels:
-
App Development
-
Articles
-
Creating Analytics
-
Deployment
-
Developer Toolkit
-
Direct Discovery
-
Integration
-
Layout & Visualizations
-
Management
-
New to QlikView
-
OCX
-
Product Documentation
-
QlikView Applications
-
QlikView Connector for Salesforce
-
QlikView Publisher
-
Scripting
-
Security
-
Technical Brief
-
Video Tutorials
What is a Mapping Load
Mapping Load is definitely one of those essential tools for your QlikView and Qlik Sense scripting. Similar to a left join, but different in distinct ways that allow you to do cool things in your QlikView scripts that would be d
...What is a Mapping Load
Mapping Load is definitely one of those essential tools for your QlikView and Qlik Sense scripting. Similar to a left join, but different in distinct ways that allow you to do cool things in your QlikView scripts that would be difficult to do or would otherwise involve many steps.
Basically a mapping load allows you to “map in” a set of values to a recipient table based on a key field.
We will first look at the properties of these functions and examine the syntax. Then we will review 8 different applications of this to help you understand where these functions are a good fit.
The script below utilizes QlikView in this case, but we can apply these scripting techniques directly to Qlik Sense as well with the exception of the “from” statements which get changed to library connections.
Highlights of Mapping Load and ApplyMap
- Mapping loads come in two parts. First, a mapping table must be created. Then the map can be applied.
- Maps always consist of two fields. The first field is the key field that will be used to make the translation (the ID). The second field contains the values to be mapped.
- Once a map is created, it is held in memory until the script finishes and is then dropped. It can be reused as many times as needed in the script.
- When a map is applied, only the first encountered value from the mapped table is brought over.
- You can specify an optional value if no match is found for the mapped table.
Syntax for Mapping Load and ApplyMap
We first must create the map. Simply use a load prefix of “Mapping” to indicate this is a mapped table

- Note again that this is considered a temporary table in Qlik and will be dropped automatically at the end of the script.
- Also be aware that the first field is ALWAYS the key and the second field is ALWAYS the mapped value. The reason I emphasize this is because it is not important what the field names are called. Only the order matters.
- As long as the map table appears before we apply it, the map table can be anywhere in the script. I usually position it on the same script tab above the table I will be applying it to, but when I have maps that are applied several times, I might put that map load in script tab towards the front.
Then we can apply the map wherever needed. We will use the ApplyMap function where the first parameter is the map name (in single quotes), the second parameter is the key we use to translate the map from the current table and an optional third parameter will define a value when no match is found.

- A map can be applied multiple times within a script.
- We must use single quotes when referring to the map name.
- Note also that the key in the receiving table does not actually need to loaded as a separate field. In the example above, CustomerID has simply been commented out since we do not need to display this field in the app. We use it to translate the map but that is all we need it for.
Use Case 1 – Avoid Duplication in Fact Tables
Our central table is sacred. If we need to sum up sales or count rows or calculate any sort of metric, this is likely your fact table. It is important that maintain the integrity of this table and do not inadvertently add rows to it since that would mess up your calculations.
But there are times when we need to join data to this table. You might think that a left join is the way to do this. But what if the fields we use to join this table to our fact table actually have repeats? Notice in the charts below, when we do a left join, it will actually add records to the fact table. Now our totals are exaggerated for that customer.

If instead we do a mapping load, we ensure that only one of the ID records actually maps into the receiving table. In fact, the first record “Walmart” is mapped in and the second value “Wal-Mart” is discarded only because the load will encounter the “Walmart” value first in the current ordering of the map table.

Use Case 2 – Slowly Changing Dimensions – Only the Latest Value
This trait of mapping loads is also handy when we only want one value from the map but we want a specific value. Similar to the scenario above, if Walmart had changed their name at some point, we might want only the latest name. If we sort the table by the “Date Modified” field in descending order, we will only get the latest value. This can be helpful for mapping in slowly changing dimensions where we only want one of the values.


Use Case 3 – Easier to Manage than “Nested If’s”
Let’s consider a scenario where we have survey results on a numbered scale from 1-5. It might be handy to add the description for the numbers. We could create a “nested if” statement to handle this. This will work perfectly fine, but as this list gets larger, it might be difficult to maintain.

It might be better to map these values in, especially as the number of values in the list increases. Because the values can be provided in a table, this process becomes much easier to maintain as the number of distinct values grow.


Use Case 4 – Apply a Map and Do Math in the Same Step
Often times we must do a calculation within our script like “Quantity * Price as Extended_Amount”. But what about when the calculation we need must occur between fields that are not in the same table?
A mapping load can provide a quick answer here as well. The benefit here is that we can map the value in AND do the math in the same step. Without the mapping load function, we would be forced to join the second field to the first table and then reload the whole table using resident load.
In the example below, we need to come up with an extended cost of goods sold. But the standard cost of the item is retained in the item master, a separate table from our sales table. We will apply the cost to the sale record and do the calculation at the same time.


Use Case 5 – Reuse a Map Multiple Times
Often times, we will encounter an “attributes” table. This is a catch-all table that holds all textual descriptions for many ID fields. This single table might hold item descriptions, product families, reporting segments, etc. These tables have at least 3 columns: 1 for the value ID, 1 for the field ID and the text descriptor.
In this case, we can load this table as a map and then refer to it multiple times, wherever needed throughout our script, loading these text descriptions into appropriately named fields in our data model. Notice that we are concatenating the ValueID and the FieldID in the map and then using both fields in the map application as well. This ensures that if a ValueID has a repeat, we are not accidentally pulling text for a different field.
Below, we are applying the map once for our item description and then again for our category description.


Use Case 6 – Reference a Default Value When No Match Is Found
Often times, a business requirement will state that rather than a null value, we would like to see “No Description” for an item or “n/a” for example.
If you need to define a default value when there is no match, we can provide this value as a third parameter in the applymap function.
This example shows the simple use of a “no description” label when no match is found.


Use Case 7 – Reference a Backup Map When No Match Is Found
This is my favorite use-case for mapping loads. I have definitely had the situation where a client has said, “Well, first try find a match from this SQL table, but if there is no match, then try this spreadsheet, and if there is still no match, put n/a”.
Again, using the applymap third parameter, we can nest a backup applymap in the third parameter to meet this requirement. We could have an endless list of maps to satisfy the requirement, although I have never gone beyond three levels!
In this example, we will first go to the SQL table, then to a spreadsheet as a backup and then if there is still no match, we will add a manual description of “no description”.


Use Case 8 – Using a Map with Concatenated Keys
There might be times when our key needs to be a little more complex. Sometimes two or three fields are needed to key the mapped values to your receiving table, but as you recall, the mapping table can only have two fields.
In these cases, you can create one field that combines the keys. Just remember that you will have to create the same key when you apply the map. Learn Qlikview.


Source: Living Qlikview
- Labels:
-
Technical Brief
A derivative of the QlikView System Monitor for versions 10/11, finally the QlikView 12-compatible version has arrived. The UI has undergone some changes and the structure/setup has been simplified. This application will read your QVS machine logs an
...A derivative of the QlikView System Monitor for versions 10/11, finally the QlikView 12-compatible version has arrived. The UI has undergone some changes and the structure/setup has been simplified. This application will read your QVS machine logs and output all kinds of information for you, such as virtual memory warnings, PGO/.Shared errors, user trending and utilization, and chronological logging events across the system.
If you're looking for the QV 11.2 version, please find it here.
Thanks for your patience and if you have any questions/comments please post to this thread!
Best,
MT !
Hi all,
the product JDBC Connector reached end-of-life because it's technically outdated. Support of it ends 2018-12-31.
The successor product is the TIQ Java Service Connector and can be obtained here:
...Hi all,
the product JDBC Connector reached end-of-life because it's technically outdated. Support of it ends 2018-12-31.
The successor product is the TIQ Java Service Connector and can be obtained here:
https://www.tiq-solutions.de/en/tiq-java-service-connector/
Best regards,
Ralf
--------------------------------
Hi everyone,
this is a demo version of our JDBC Connector for QlikView. It will enable a lot of non-ODBC/OLEDB sources for loading data into QlikView.
Also, it would give much more performance on QV 9 loads (Oracle, mysql etc.) and could speed up on complex network environments (like VPN, firewalls, WAN).
Please try it out and give us some feedback!
Installation instructions:
- install the JDBC Connector and config the JDBC driver (mostly a .jar file)
- connect with JDBC URL (e.g. jdbc:oracle:thin:@localhost:1521:ex)
- example connect statement for Oracle (will be included by connect popup):
CUSTOM CONNECT TO "Provider=JDBCConnector_x64.dll;jdbc:oracle:thin:@localhost:1521:ex;XUserId=SbKdMaFNRLOA;XPassword=aWELJaFNRbTA;";
Missing feature (waiting for QV support):
- no select option for database/owner on table wizzard
Thanks to my colleague Sven "Benno" Uhlig who brought up this idea and implementation!
Ralf
UPDATE:
This is a new version which supports DDL and DML statements too. You will get a result set if a DML statement was executed with the update count.
Just try script calls like this:
DATA:
SQL CREATE TABLE test2 (col1 INT)
;
SQL insert into test2 (col1) values (1)
;
SQL update test2 set col1=2
;
SQL drop table test2
;
UPDATE:
New version comes with an installer and config dialogs. See also: http://www.tiq-solutions.de/display/enghome/ENJDBC for a list of possible JDBC sources.
- Labels:
-
Scripting
As QlikView applications grow the number of tabs that information is spread across can grow rapidly as well. The new Ajax view makes it easier to navigate when there are many tabs (with the drop down) but if users are using the IE Plugin or an olde
...As QlikView applications grow the number of tabs that information is spread across can grow rapidly as well. The new Ajax view makes it easier to navigate when there are many tabs (with the drop down) but if users are using the IE Plugin or an older version of QlikView a lot of the screen can be taken up with tabs.
One way of solving this is to group the tabs into functional areas and place a menu on the welcome tab that allows the user to select which functional area they want to look at.
Furthermore, if some tabs are simply not relevant to some users then it is possible to hide those tabs (and the menu options to show them) from those users.
This document gives an example of a menu that switches tabs on and off and implements hiding of tabs from users based on their OSUser name - loaded from an Inline table in the load script.
I hope you find this document useful, you can find links to other documents I have uploaded here: http://www.quickintelligence.co.uk/qlikview-examples/
Steve