Unlock a world of possibilities! Login now and discover the exclusive benefits awaiting you.
- Qlik Community
- :
- All Forums
- :
- QlikView App Dev
- :
- Plot values in a chart using Macro VBScript
- Subscribe to RSS Feed
- Mark Topic as New
- Mark Topic as Read
- Float this Topic for Current User
- Bookmark
- Subscribe
- Mute
- Printer Friendly Page
- Mark as New
- Bookmark
- Subscribe
- Mute
- Subscribe to RSS Feed
- Permalink
- Report Inappropriate Content
Plot values in a chart using Macro VBScript
Hi guys
I need to plot some values in a chart just using macro. The dimension is "Data Base" and the value is the "Final Average". How can i plot this values using just macros?
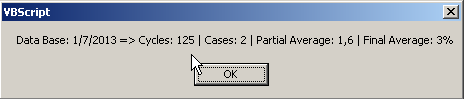
Here is the values: *(one value per iteration, at end the chart must be with all values calculated)
Can anybody help me with this problem?
Thanks
Accepted Solutions
- Mark as New
- Bookmark
- Subscribe
- Mute
- Subscribe to RSS Feed
- Permalink
- Report Inappropriate Content
Try to implement all those expression in script level by joining tables and plot the table.
- Mark as New
- Bookmark
- Subscribe
- Mute
- Subscribe to RSS Feed
- Permalink
- Report Inappropriate Content
Quite unlikely. And, so "un-QlikView"... If there is a data in the application to use in the macro, there must be a way to build a chart using proper calculations.
- Mark as New
- Bookmark
- Subscribe
- Mute
- Subscribe to RSS Feed
- Permalink
- Report Inappropriate Content
Yes Michael, but this is a special case, because this values is calculated based on complex expressions that involves values of different tables and looking for each date the last 12 months values.
Resuming, the macro is done and i have already the values. Now, i just need to plot.. this is my problem.
Thank you
- Mark as New
- Bookmark
- Subscribe
- Mute
- Subscribe to RSS Feed
- Permalink
- Report Inappropriate Content
Try to implement all those expression in script level by joining tables and plot the table.
- Mark as New
- Bookmark
- Subscribe
- Mute
- Subscribe to RSS Feed
- Permalink
- Report Inappropriate Content
Ok, problem solved.
Thanks