Unlock a world of possibilities! Login now and discover the exclusive benefits awaiting you.
- Qlik Community
- :
- All Forums
- :
- QlikView App Dev
- :
- Hiding Cumulative Graph Portion when Value is Zero
- Subscribe to RSS Feed
- Mark Topic as New
- Mark Topic as Read
- Float this Topic for Current User
- Bookmark
- Subscribe
- Mute
- Printer Friendly Page
- Mark as New
- Bookmark
- Subscribe
- Mute
- Subscribe to RSS Feed
- Permalink
- Report Inappropriate Content
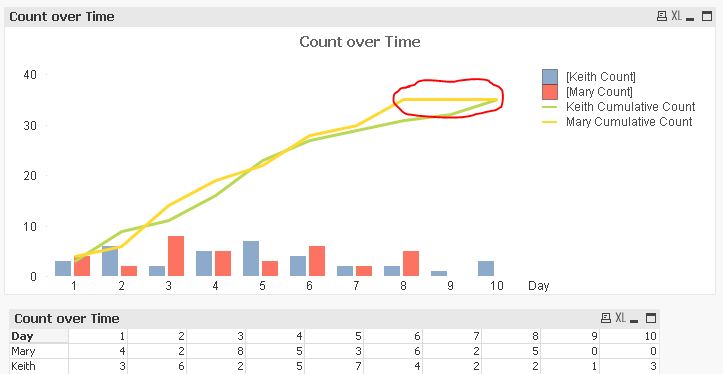
Hiding Cumulative Graph Portion when Value is Zero
Hello,
Is there a way to hide the flat, circled portion of the yellow cumulative graph below ("Mary Cumulative Count"), since the values for Days 9 and 10 are Zero for Mary? I would like the graph and table to look exactly the same, but for the yellow cumulative line to stop at Day 8.
Attached is the QlikView file for reference.
Thank you!
Irene
- Mark as New
- Bookmark
- Subscribe
- Mute
- Subscribe to RSS Feed
- Permalink
- Report Inappropriate Content
In 3er and 4rt expression you check accumulative., is for that the line grow.
If you put nos accumulative is llok fine.
- Mark as New
- Bookmark
- Subscribe
- Mute
- Subscribe to RSS Feed
- Permalink
- Report Inappropriate Content
Hi Facundo - I want the yellow line to display cumulative, so I need that checked. I just want the line to display up until month 9 (do not display for month 9 and 10 ONLY).
Thanks,
Irene
- Mark as New
- Bookmark
- Subscribe
- Mute
- Subscribe to RSS Feed
- Permalink
- Report Inappropriate Content
In expression you can put this. but never dissapear beacuse you has in the dimension de Day.
Expression 3 =
sum( {$< Day = {'1','2','3','4','5','6','7','8'}>} [Keith Count] )
Expression 4 =
sum( {$< Day = {'1','2','3','4','5','6','7','8'}>} [Mary Count])
Regards