Unlock a world of possibilities! Login now and discover the exclusive benefits awaiting you.
- Qlik Community
- :
- All Forums
- :
- QlikView App Dev
- :
- How to create a bar graph with the same pseudo-var...
- Subscribe to RSS Feed
- Mark Topic as New
- Mark Topic as Read
- Float this Topic for Current User
- Bookmark
- Subscribe
- Mute
- Printer Friendly Page
- Mark as New
- Bookmark
- Subscribe
- Mute
- Subscribe to RSS Feed
- Permalink
- Report Inappropriate Content
How to create a bar graph with the same pseudo-variable appearing twice in the same table
Hi, I have this problem:
I have a set of data with 2 variables IN and OUT, and their respective counters:
Table1:
LOAD * INLINE [
ID, IN, OUT, COUNTIN, COUNTOUT
1, , A, 0, 1
2, A, A, 1, 1
3, , B, 0, 1
4, B, B, 1, 1
5, A, C, 1, 1
6, , A, 0, 1
7, , C, 0, 1
8, C, C, 1, 1
9, A, A, 1, 1
10, A, B, 1, 1
11, , C, 0, 1
12, B, D, 1, 1
];
I'd like to have a bar graph containing the proportion between the number of occurences of each group in IN and the number of occurences of this same group in OUT.
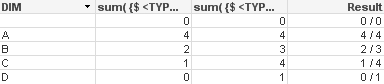
The dimension would be the group. So, the answer would be
A = 4/4
B = 2/3
C = 1/4
How can I make this?
Thanks in advance.
Accepted Solutions
- Mark as New
- Bookmark
- Subscribe
- Mute
- Subscribe to RSS Feed
- Permalink
- Report Inappropriate Content
- Mark as New
- Bookmark
- Subscribe
- Mute
- Subscribe to RSS Feed
- Permalink
- Report Inappropriate Content
See the load script and chart in the attached.
- Mark as New
- Bookmark
- Subscribe
- Mute
- Subscribe to RSS Feed
- Permalink
- Report Inappropriate Content
this is my result, see atacchment for details