Unlock a world of possibilities! Login now and discover the exclusive benefits awaiting you.
- Qlik Community
- :
- All Forums
- :
- QlikView App Dev
- :
- Straight table to pie chart
- Subscribe to RSS Feed
- Mark Topic as New
- Mark Topic as Read
- Float this Topic for Current User
- Bookmark
- Subscribe
- Mute
- Printer Friendly Page
- Mark as New
- Bookmark
- Subscribe
- Mute
- Subscribe to RSS Feed
- Permalink
- Report Inappropriate Content
Straight table to pie chart
Hello guys!
I have a straight table that looked like this
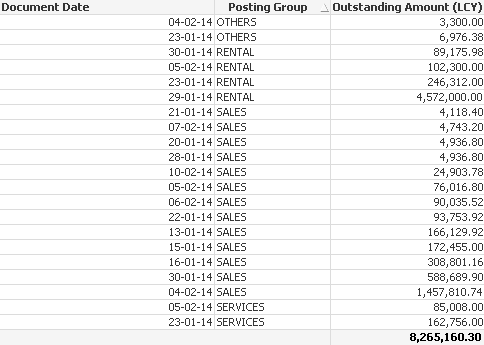
With the [Document Date] and [Posting Group] being the dimensions while [Outstanding Amount (LCY)] is the expression express like the following
=IF([Document Date]>=MIN(CDate) and [Document Date]<=MAX(CDate),SUM([Outstanding Amount (LCY)]))
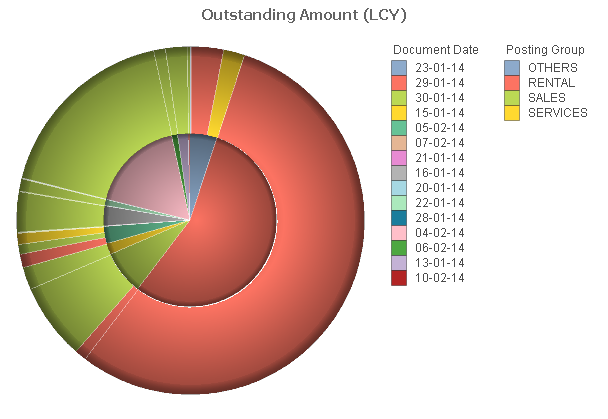
So you might already be able to guess that the straight table above will display data based on selected value i.e. currently selected year 2014. The problem is that when I change the table to pie chart using the same dimensions and expession the pie chart would looked like this:
My question is : What can be done so that the pie chart would only show the [Posting Group] slices and the slices, like the straight table will change based on selected value (say if you select year 2014 from a list box). I tried removing the [Document Date] from the dimension so that it will only have the [Posting Group] as the dimension and [Outstanding Amount (LCY)] is the expression express like the one in the straight table which is =IF([Document Date]>=MIN(CDate) and [Document Date]<=MAX(CDate),SUM([Outstanding Amount (LCY)])) but it didn't display any data.
Any suggestions and opinions would greatly appreciated. 
Thank you for you kind attention guys! 
- Mark as New
- Bookmark
- Subscribe
- Mute
- Subscribe to RSS Feed
- Permalink
- Report Inappropriate Content
You can create two different objects as per your requirements.. 1) Straight Table 2) Pie Chart
Use Conditional Show under Layout Tab to show them...
i.e. Create a Variable vSHOW = 1
Now Create a Button
Go to action tab >> ADD >> External >> Set Variable
Variable : vSHOW
Value : if(vSHOW = 1, 0,1)
Straight Table >> Layout >> Conditional Show >> vSHOW = 1
Pie Char >> Layout >> Conditional Show >> vSHOW = 0
Hope this helps..
- Mark as New
- Bookmark
- Subscribe
- Mute
- Subscribe to RSS Feed
- Permalink
- Report Inappropriate Content
Hello Manish Kachhia.
Erm, from my understanding that is to show/hide objects right? My problem is that I'm trying to convert the given straight table to a pie chart. But instead showing of the [Posting Date] slices in the pie chart, I want it to only show [Posting Group] slices but selecting say a value i.e Year from a listbox would populate the pie chart slices accordingly as in the straight table.
Thank you very much for your kind attention
- Mark as New
- Bookmark
- Subscribe
- Mute
- Subscribe to RSS Feed
- Permalink
- Report Inappropriate Content
Don't know whether this could be possible in fast type change.
May be someone can provide better solution.
- Mark as New
- Bookmark
- Subscribe
- Mute
- Subscribe to RSS Feed
- Permalink
- Report Inappropriate Content
In straight table you used date as Dimension ,copy the same chart then eliminate date in dimension then you can use show and hide options .
- Mark as New
- Bookmark
- Subscribe
- Mute
- Subscribe to RSS Feed
- Permalink
- Report Inappropriate Content
Guys.
Well actually this is what I want to have
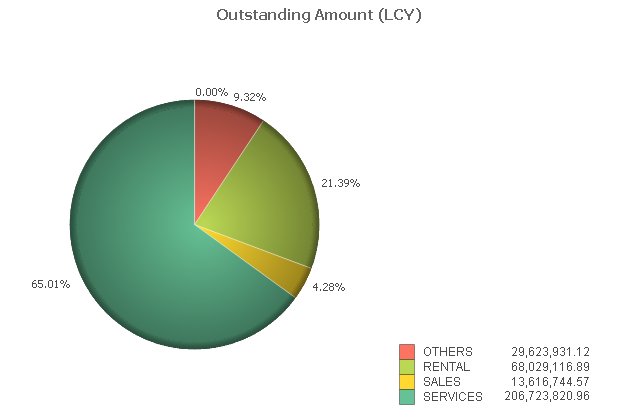
The pie no longer show [Posting Date] slices even though the posting date is part of the dimension of the pie chart
- Mark as New
- Bookmark
- Subscribe
- Mute
- Subscribe to RSS Feed
- Permalink
- Report Inappropriate Content
can you share sample one
- Mark as New
- Bookmark
- Subscribe
- Mute
- Subscribe to RSS Feed
- Permalink
- Report Inappropriate Content
Hello Sunil Kumar,
Attached is a sample file.
Thank you for your kind attention
- Mark as New
- Bookmark
- Subscribe
- Mute
- Subscribe to RSS Feed
- Permalink
- Report Inappropriate Content
I think I got your problem,you just want to show the pie chart with the contribution of these 4 departments?is that correct?
If yes, then if([Gen_ Prod_ Posting Group]='GOODS','SALES',[Gen_ Prod_ Posting Group]) as department
this goes in the backend reload it and in the dimension take this department with the same expression and I think you'll get what you expect...
Does that help?