Unlock a world of possibilities! Login now and discover the exclusive benefits awaiting you.
- Qlik Community
- :
- All Forums
- :
- QlikView App Dev
- :
- Some of my bar graph bars are offset and I cannot ...
- Subscribe to RSS Feed
- Mark Topic as New
- Mark Topic as Read
- Float this Topic for Current User
- Bookmark
- Subscribe
- Mute
- Printer Friendly Page
- Mark as New
- Bookmark
- Subscribe
- Mute
- Subscribe to RSS Feed
- Permalink
- Report Inappropriate Content
Some of my bar graph bars are offset and I cannot change them
Hello all,
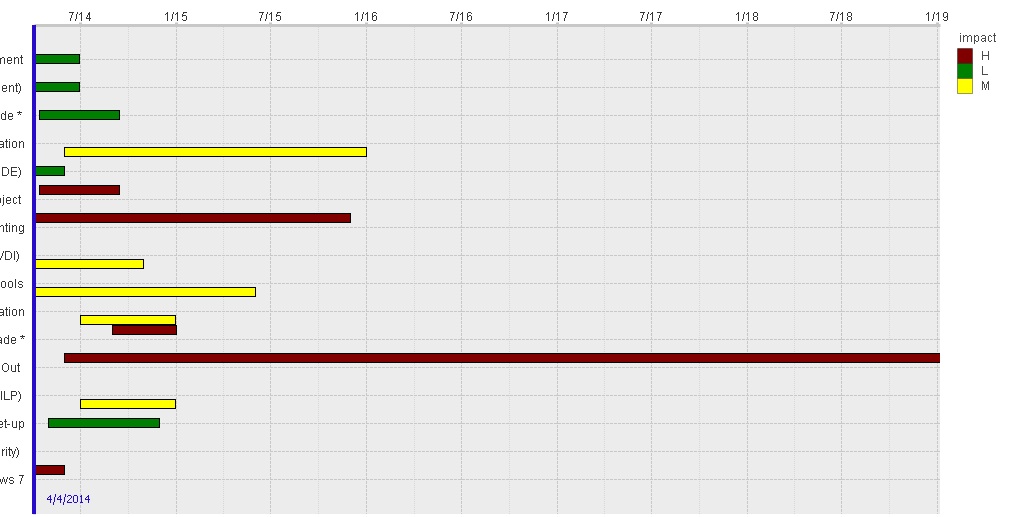
I am using a vertical bar chart to display a Gantt chart within QlikView. I have already gotten all the data to be displayed correctly and as I want it. However, I noticed that when a large amount of projects are selected (I have vertical scroll enabled to not limit any results), some of the bars become skewed randomly. It always to appear to be the same projects which is strange. When I click on that offset bar, it is displayed fine. I have tried tweaking the bar distance and clutter distance to no avail. I included pics to better show what I am talking about.
As you can see, the one with the * as well as others are very offset from the x-axis minor grid lines.
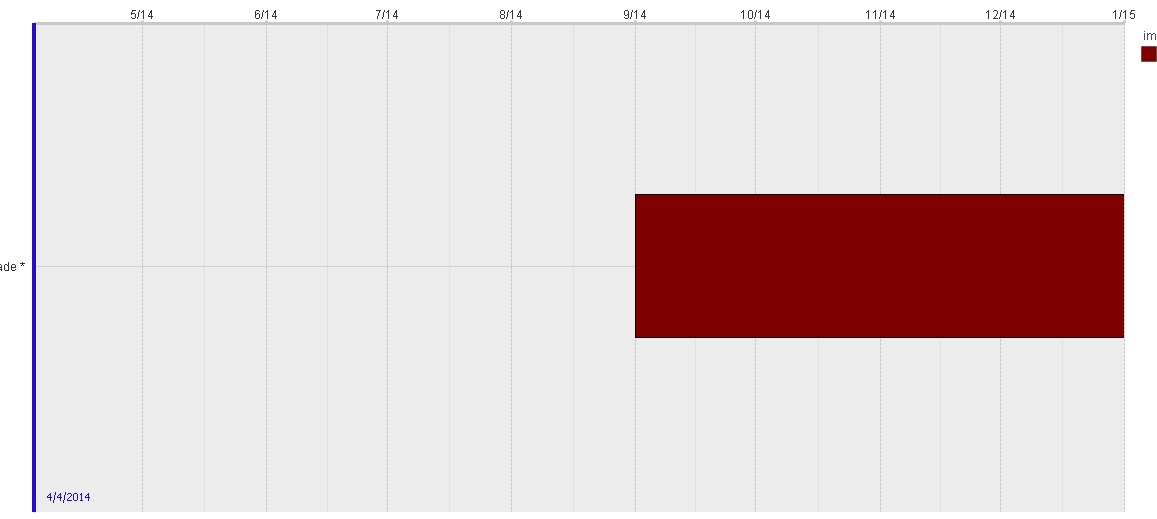
However, when I clicked on the one with the * it is completely aligned on the x-axis.
Thank you,
Pete
Accepted Solutions
- Mark as New
- Bookmark
- Subscribe
- Mute
- Subscribe to RSS Feed
- Permalink
- Report Inappropriate Content
You're using either two dimensions or three expressions. For each value on the y-axis space is reserved for each possible Impact bar, i.e. spaces for three bars for each y-axis value. If you're using two dimensions perhaps you can use a calculated dimension. See attached qvw.
talk is cheap, supply exceeds demand
- Mark as New
- Bookmark
- Subscribe
- Mute
- Subscribe to RSS Feed
- Permalink
- Report Inappropriate Content
Hi.
Seems ok to me. Could you upload the sample ?
- Mark as New
- Bookmark
- Subscribe
- Mute
- Subscribe to RSS Feed
- Permalink
- Report Inappropriate Content
Using the dual statement as a single dimension solved it. Thank you very much!