Unlock a world of possibilities! Login now and discover the exclusive benefits awaiting you.
- Qlik Community
- :
- All Forums
- :
- QlikView App Dev
- :
- Line chart - accumulated number of open cases over...
- Subscribe to RSS Feed
- Mark Topic as New
- Mark Topic as Read
- Float this Topic for Current User
- Bookmark
- Subscribe
- Mute
- Printer Friendly Page
- Mark as New
- Bookmark
- Subscribe
- Mute
- Subscribe to RSS Feed
- Permalink
- Report Inappropriate Content
Line chart - accumulated number of open cases over time
All,
I’m creating a qlikview for defect management for a large programme, and need to show the number of defects that are open and closed at any one time (see below for current excel version).
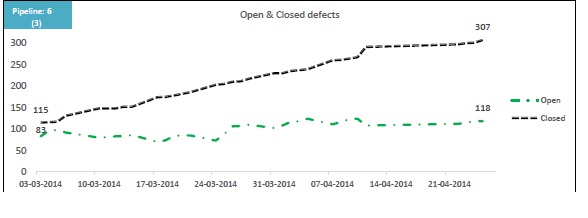
The data I’m reading in looks like this:
Case ID, Case description, Project, Team, Severity, State, Created date, Closed date
I found ways of doing a simple accumulation, and I can do the calculations myself outside of qlikview and read those in (then it works too), but I want to be able to see how individual projects are progressing, as well as teams, and severity level, without having do to all the calculations outside of qlikview.
I’m very new to qlikview, so easy instructions would be appreciated
Thanks in advance!
- Mark as New
- Bookmark
- Subscribe
- Mute
- Subscribe to RSS Feed
- Permalink
- Report Inappropriate Content
Qlikview works on association logic. Hence if your data model is properly made to define the association among the tables correct, qv can handle most of the things dynamically in the front-end. For your case, if you create a line chart with date(of your interest) as dimension and expression like,: =Count( {<[Case Description]={'Closed'}>}[Case ID] ), smilarly another one for 'Open', you would get to select from any of other dimensions/fields(like Project, Team..) in list box, to get the desired result on the fly.
- Mark as New
- Bookmark
- Subscribe
- Mute
- Subscribe to RSS Feed
- Permalink
- Report Inappropriate Content
Thanks Tresesco..
It doesn't quite work the way I need it. For each of my cases, the created and closed date is on the same line in the table, so in order to find out how many cases are open, I need to sum the number of open cases on that date, and then subtract the number of closed cases and then accumulate (I'm using the dates related to "created date"). Additionally, I need to show which cases were open on a selected day (next step after the line chart is in place), and that requires looking at both the created and closed dates for a defect.
Thanks
Kirstin