Unlock a world of possibilities! Login now and discover the exclusive benefits awaiting you.
- Qlik Community
- :
- All Forums
- :
- QlikView App Dev
- :
- scatter chart formating
Options
- Subscribe to RSS Feed
- Mark Topic as New
- Mark Topic as Read
- Float this Topic for Current User
- Bookmark
- Subscribe
- Mute
- Printer Friendly Page
Turn on suggestions
Auto-suggest helps you quickly narrow down your search results by suggesting possible matches as you type.
Showing results for
Not applicable
2014-06-20
01:59 AM
- Mark as New
- Bookmark
- Subscribe
- Mute
- Subscribe to RSS Feed
- Permalink
- Report Inappropriate Content
scatter chart formating
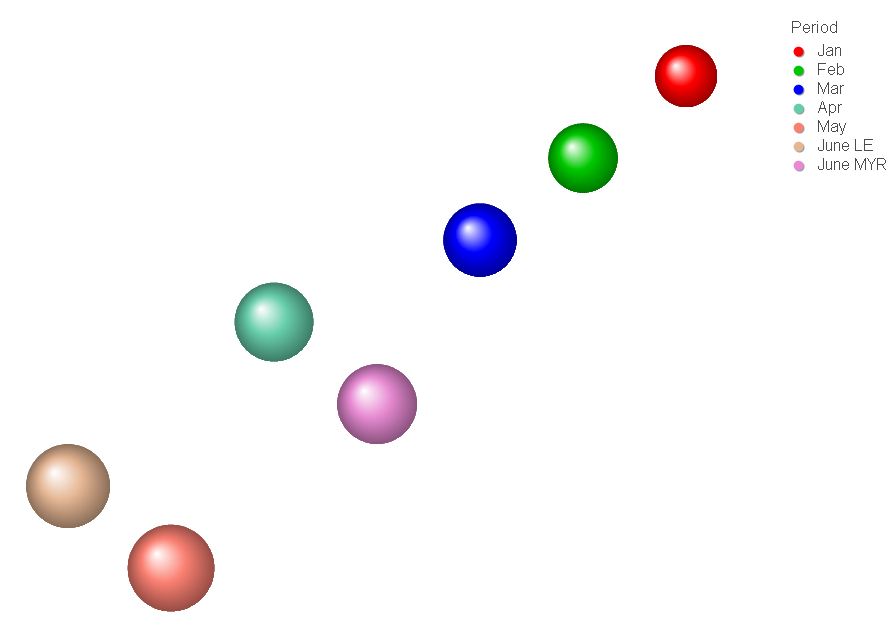
Just playing with my first scatter chart and have a couple of questions.
The chart below has demand on the x axis , inventory on the y and days cover on z
What I would like to do is
1) to display the z data field in the bubble
2) determine the max and min bubble size to be able to differentiate them further
Any help would be appreciated
Cheers
150 Views
0 Replies