Unlock a world of possibilities! Login now and discover the exclusive benefits awaiting you.
- Qlik Community
- :
- All Forums
- :
- QlikView App Dev
- :
- How to create a customized trend line in a chart?
- Subscribe to RSS Feed
- Mark Topic as New
- Mark Topic as Read
- Float this Topic for Current User
- Bookmark
- Subscribe
- Mute
- Printer Friendly Page
- Mark as New
- Bookmark
- Subscribe
- Mute
- Subscribe to RSS Feed
- Permalink
- Report Inappropriate Content
How to create a customized trend line in a chart?
Hi, I need to create a customized linear trend line of the graph shown below:
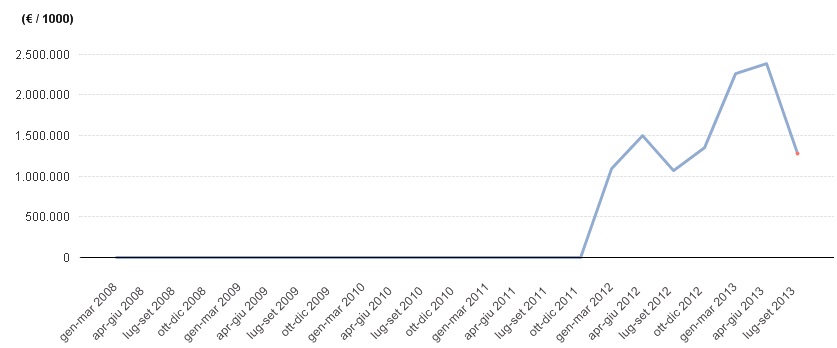
My trend line should start from the value of "gen-mar 2008" (aproximately 0 in this case) and go straight to the value of "lug-set 2013" (aproximately 1,300,000). How can I do that? Thanks.
- Mark as New
- Bookmark
- Subscribe
- Mute
- Subscribe to RSS Feed
- Permalink
- Report Inappropriate Content
Add another expression. Something like =if(Month=min(total Month) or Month=max(total Month), sum(Value)). And don't suppress Zero-Values.
talk is cheap, supply exceeds demand
- Mark as New
- Bookmark
- Subscribe
- Mute
- Subscribe to RSS Feed
- Permalink
- Report Inappropriate Content
La cosa più semplice che mi viene in mente è quella di caricare con un load inline una serie di valori da utilizzare poi come espressione:
quaklcosa simile a:
load * inline [
mese, qty
gen-mar 2008, 0
apr-mag 2008, 1000
..... e così via fino al tuo valore
];
fammi sapere
- Mark as New
- Bookmark
- Subscribe
- Mute
- Subscribe to RSS Feed
- Permalink
- Report Inappropriate Content
It's not my case, the dimension is dynamic as is the range of months.
- Mark as New
- Bookmark
- Subscribe
- Mute
- Subscribe to RSS Feed
- Permalink
- Report Inappropriate Content
My chart is dynamic, the user can select the period of analysis and through the set analysis i check the dates. If I understood well I should write something like this:
if(Dimension1='gen-mar 2008' or Dimension1='lug-set 2013', sum(Value)).
Is that correct?
- Mark as New
- Bookmark
- Subscribe
- Mute
- Subscribe to RSS Feed
- Permalink
- Report Inappropriate Content
I solved writing this:
=If(Only({$<DATE={">=$(vDateMin)<=$(vDateMax)"}>} MonthName(DATE))=MonthName('$(vDateMin)')
OR
Only({$<DATE={">=$(vDateMin)<=$(vDateMax)"}>} MonthName(DATE))=MonthName('$(vDateMax)') ,
Sum({$<DATE={">=$(vDateMin)<=$(vDateMax)"}>} VALUE)
)
Where vDateMin and vDateMax are variables edited by the user, and MonthName(DATE) is the calculated dimension of the chart.