Unlock a world of possibilities! Login now and discover the exclusive benefits awaiting you.
- Qlik Community
- :
- All Forums
- :
- QlikView App Dev
- :
- aggr in pivot table not showing in all rows
- Subscribe to RSS Feed
- Mark Topic as New
- Mark Topic as Read
- Float this Topic for Current User
- Bookmark
- Subscribe
- Mute
- Printer Friendly Page
- Mark as New
- Bookmark
- Subscribe
- Mute
- Subscribe to RSS Feed
- Permalink
- Report Inappropriate Content
aggr in pivot table not showing in all rows
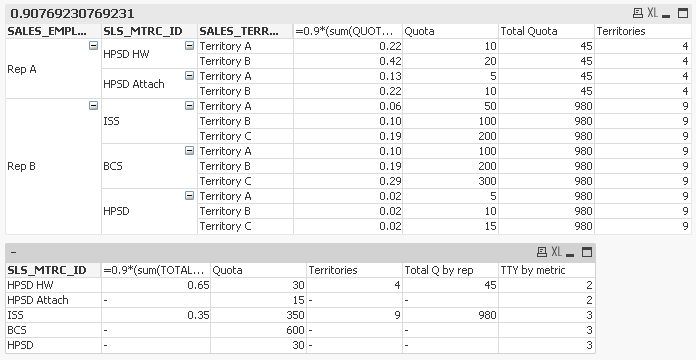
Hi, I have the below example, in first table I have everything, but I need to show it like in the second one, only by SLS_MTRC_ID,
to count the total number of sales_territories I'm using this formula: aggr(count(SALES_TERRITORY_ID),SALES_EMPLOYEE_ID), which is giving me the correct figures 4 and 9, but why do they show up only for the first sales_metric dimension row of each employee?
Same for total Q by rep: aggr(sum(QUOTA_SALES_METRIC),SALES_EMPLOYEE_ID)
Accepted Solutions
- Mark as New
- Bookmark
- Subscribe
- Mute
- Subscribe to RSS Feed
- Permalink
- Report Inappropriate Content
Hi Oscar,
let's Try below expression:
aggr( Nodistinct count(SALES_TERRITORY_ID),SALES_EMPLOYEE_ID),
aggr( Nodistinct sum(QUOTA_SALES_METRIC),SALES_EMPLOYEE_ID)
Post your data in excel file.
Thanks,
Muni
- Mark as New
- Bookmark
- Subscribe
- Mute
- Subscribe to RSS Feed
- Permalink
- Report Inappropriate Content
Hi,
When using aggr you need to take care about the involved dimensions in your chart.
In the case of your example for the second chart you're creating a chart with SLS_MTRC_ID as dimension. then your formula should be something like this (it's what I can figure out just by seeing the screenshots):
aggr(count(SALES_TERRITORY_ID),SALES_EMPLOYEE_ID, SLS_MTRC_ID)
Also, as tip try not to use key fields directly in expressions. It is recommended to create a duplicate of these fields if you want to include fields that are link between different tables in charts,
regards
- Mark as New
- Bookmark
- Subscribe
- Mute
- Subscribe to RSS Feed
- Permalink
- Report Inappropriate Content
Hi Oscar,
let's Try below expression:
aggr( Nodistinct count(SALES_TERRITORY_ID),SALES_EMPLOYEE_ID),
aggr( Nodistinct sum(QUOTA_SALES_METRIC),SALES_EMPLOYEE_ID)
Post your data in excel file.
Thanks,
Muni
- Mark as New
- Bookmark
- Subscribe
- Mute
- Subscribe to RSS Feed
- Permalink
- Report Inappropriate Content
Great! that was it, thank you very much