Unlock a world of possibilities! Login now and discover the exclusive benefits awaiting you.
- Qlik Community
- :
- All Forums
- :
- QlikView App Dev
- :
- Pivot table - dimension repeat
- Subscribe to RSS Feed
- Mark Topic as New
- Mark Topic as Read
- Float this Topic for Current User
- Bookmark
- Subscribe
- Mute
- Printer Friendly Page
- Mark as New
- Bookmark
- Subscribe
- Mute
- Subscribe to RSS Feed
- Permalink
- Report Inappropriate Content
Pivot table - dimension repeat
below is the create table script
create table region (area varchar2(30), district varchar2(30), city varchar2(30));
insert into region values ('chandigarh', 'chandigarh', 'chandigarh');
insert into region values ('punjab', 'patiala', 'patiala');
insert into region values ('punjab', 'patiala', 'nabha');
insert into region values ('punjab', 'patiala', 'SAN');
insert into region values ('punjab', 'SAS', 'SAS');
insert into region values ('punjab', 'SAS', 'ZRK');
i added all column area , district, and city in dimension of PIVOT table
in city i have repeated values same reside in DISTRICT
i dont want to see highlighted values in red box in CITY column
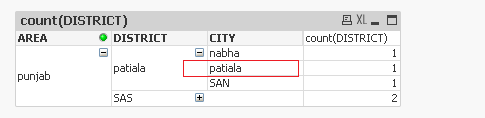
how can i limit this from -CHART - DIMENSION - PROPERTIES
- Tags:
- chart
Accepted Solutions
- Mark as New
- Bookmark
- Subscribe
- Mute
- Subscribe to RSS Feed
- Permalink
- Report Inappropriate Content
Have you checked my example????
- Mark as New
- Bookmark
- Subscribe
- Mute
- Subscribe to RSS Feed
- Permalink
- Report Inappropriate Content
Hi,
In script write below
If(district =city ,'',city ) as City
In chart suppress null values.
Regards
ASHFAQ
- Mark as New
- Bookmark
- Subscribe
- Mute
- Subscribe to RSS Feed
- Permalink
- Report Inappropriate Content
For CITY dimension use, calculated dimension: If(CITY<>DISTRICT, CITY), then in the dimension tab, select the expression and check 'Supress When Value is Null' .
- Mark as New
- Bookmark
- Subscribe
- Mute
- Subscribe to RSS Feed
- Permalink
- Report Inappropriate Content
Its showing because you have that particular value of patiala in district and city as well..
If you really want to omit it,then
instead of CITY as dimension use following as calculated dimension
if(CITY=DISTRICT,null(),CITY)
and Supress when Value is null(check the checkbox for this dimension)
PFA the example
- Mark as New
- Bookmark
- Subscribe
- Mute
- Subscribe to RSS Feed
- Permalink
- Report Inappropriate Content
thanks ashfaq, but i need to perform changes at chart level (properties).
- Mark as New
- Bookmark
- Subscribe
- Mute
- Subscribe to RSS Feed
- Permalink
- Report Inappropriate Content
then
use this
if(CITY=DISTRICT,null(),CITY) as your calculated dimension and supress null values.
Regards
ASHFAQ
- Mark as New
- Bookmark
- Subscribe
- Mute
- Subscribe to RSS Feed
- Permalink
- Report Inappropriate Content
sorry guys still not working... i will back on same soon
thanks for being there
- Mark as New
- Bookmark
- Subscribe
- Mute
- Subscribe to RSS Feed
- Permalink
- Report Inappropriate Content
Hi,
In script try like this
LOAD
*,
If(district <> city, 1, 0) AS Flag
FROM DataSource;
Now in chart try like this
Dimension: district, city
Expression:Count({<Flag={1}>}District)
Hope this helps you.
Regards,
Jagan.
- Mark as New
- Bookmark
- Subscribe
- Mute
- Subscribe to RSS Feed
- Permalink
- Report Inappropriate Content
Have you checked my example????
- Mark as New
- Bookmark
- Subscribe
- Mute
- Subscribe to RSS Feed
- Permalink
- Report Inappropriate Content
thanks i have checked ur answer ..
actullay i am writing the if statement in "Enable conditional" box,, i.e. where i performing wrong.