Unlock a world of possibilities! Login now and discover the exclusive benefits awaiting you.
- Qlik Community
- :
- All Forums
- :
- QlikView App Dev
- :
- pie chat - Value at Data point arrangment
- Subscribe to RSS Feed
- Mark Topic as New
- Mark Topic as Read
- Float this Topic for Current User
- Bookmark
- Subscribe
- Mute
- Printer Friendly Page
- Mark as New
- Bookmark
- Subscribe
- Mute
- Subscribe to RSS Feed
- Permalink
- Report Inappropriate Content
pie chat - Value at Data point arrangment
Dear All,
can there is any way to manage the value on Data Point Position ??
Thanks,
Jitendra Kumar Vishwakarma
- Mark as New
- Bookmark
- Subscribe
- Mute
- Subscribe to RSS Feed
- Permalink
- Report Inappropriate Content
Jitendra,
On your chart press CTRL+SHIFT and adjust accordingly.
Thanks,
AS
- Mark as New
- Bookmark
- Subscribe
- Mute
- Subscribe to RSS Feed
- Permalink
- Report Inappropriate Content
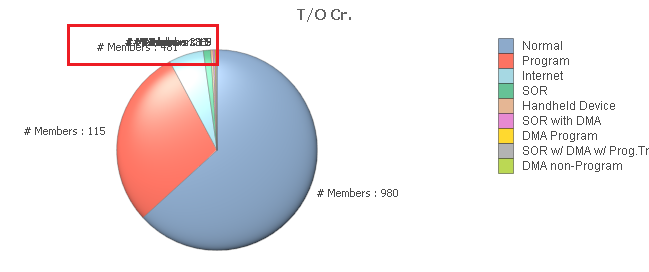
That only help me in adjusting the pie chart size, position and legend position. i want to change the Data point position .
like below
- Mark as New
- Bookmark
- Subscribe
- Mute
- Subscribe to RSS Feed
- Permalink
- Report Inappropriate Content
Hi Jitendra,
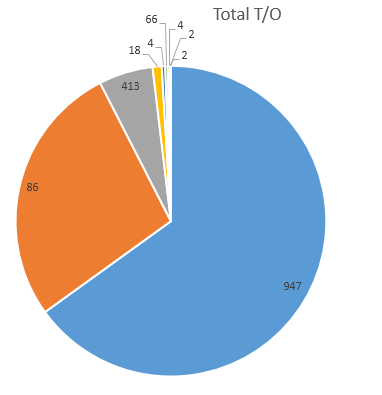
Its practically impossible to show all the small values as well.
Add dimension limits to show, in your case the first 3 values.
Remaining will be shown as others. When you further drill down.
You can see also, as to how the distribution is across those small parts.
thanks,
Rajesh Vaswani
- Mark as New
- Bookmark
- Subscribe
- Mute
- Subscribe to RSS Feed
- Permalink
- Report Inappropriate Content
Jitendra,
I think it cannot be achieved , let see if others can help us.
Please share if you find some way of doing it.
Thanks,
AS
- Mark as New
- Bookmark
- Subscribe
- Mute
- Subscribe to RSS Feed
- Permalink
- Report Inappropriate Content
Hi Jitendra,
You can consider a bar chart as well.
It would provide you the comparison the same way and serve your purpose.
thanks,
Rajesh Vaswani