Unlock a world of possibilities! Login now and discover the exclusive benefits awaiting you.
- Qlik Community
- :
- All Forums
- :
- QlikView App Dev
- :
- How to get this graph?
Options
- Subscribe to RSS Feed
- Mark Topic as New
- Mark Topic as Read
- Float this Topic for Current User
- Bookmark
- Subscribe
- Mute
- Printer Friendly Page
Turn on suggestions
Auto-suggest helps you quickly narrow down your search results by suggesting possible matches as you type.
Showing results for
Partner - Creator
2015-02-06
07:40 AM
- Mark as New
- Bookmark
- Subscribe
- Mute
- Subscribe to RSS Feed
- Permalink
- Report Inappropriate Content
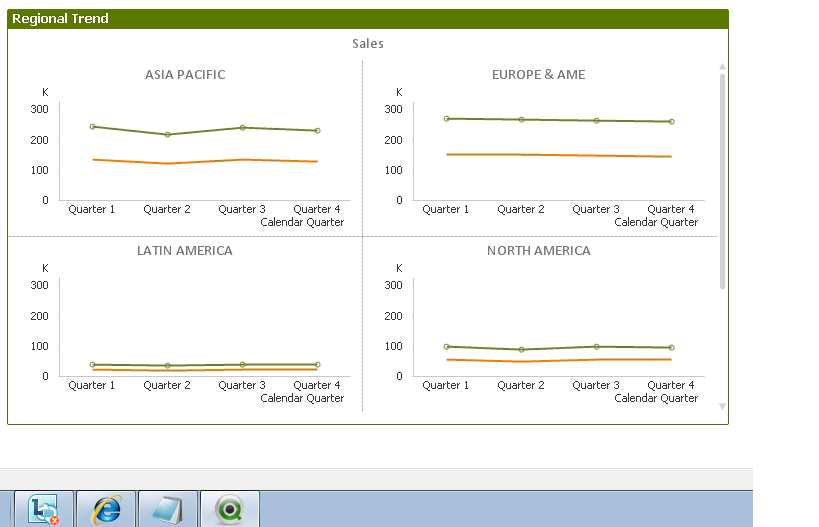
How to get this graph?
I want my graph to be look like this where it has region and quarter in it's dimension and sales, net profit in expression.
I tried to build the same graph but I am not able to get different graph for different regions like given below...... how can I get this?
358 Views
2 Replies
Partner - Creator III
2015-02-06
07:43 AM
- Mark as New
- Bookmark
- Subscribe
- Mute
- Subscribe to RSS Feed
- Permalink
- Report Inappropriate Content
Hi Prasad,
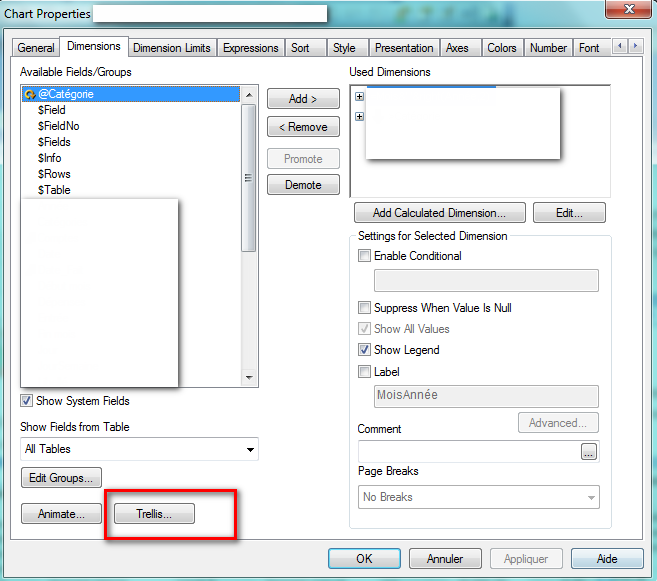
Use Region as first dimension and Quarter as the second one.
Then use the treillis like below:
Have fun with QV,
François
260 Views
Partner - Creator III
2015-02-06
07:57 AM
- Mark as New
- Bookmark
- Subscribe
- Mute
- Subscribe to RSS Feed
- Permalink
- Report Inappropriate Content
In dimension tab use click 'Trellis' and enable it from the appeard window
Yousef Amarneh
260 Views