Unlock a world of possibilities! Login now and discover the exclusive benefits awaiting you.
- Qlik Community
- :
- All Forums
- :
- QlikView App Dev
- :
- how to represent a variable in a bar graph
- Subscribe to RSS Feed
- Mark Topic as New
- Mark Topic as Read
- Float this Topic for Current User
- Bookmark
- Subscribe
- Mute
- Printer Friendly Page
- Mark as New
- Bookmark
- Subscribe
- Mute
- Subscribe to RSS Feed
- Permalink
- Report Inappropriate Content
how to represent a variable in a bar graph
hello everyone, I explain my issue.
I have a table where people are grouped into groups, each person has associated data for various calculations and the final column I have the final data of each. As in the picture below
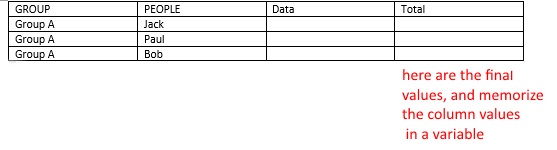
Now I would like to to represent the sum of the values in the variable in a bar chart, but if I write the expression sum ($ (variable)) nothing happens. Is there a way to do it?
- Tags:
- qlikview_scripting
- Mark as New
- Bookmark
- Subscribe
- Mute
- Subscribe to RSS Feed
- Permalink
- Report Inappropriate Content
You couldn't (really) store column calculation-values into a variable and use them into another object - it looks like a very complicated approach for a probably simple bar-chart with one or two dimensions and one expression - try it at first so simple.
- Marcus