Unlock a world of possibilities! Login now and discover the exclusive benefits awaiting you.
- Qlik Community
- :
- All Forums
- :
- QlikView App Dev
- :
- customized duration format
- Subscribe to RSS Feed
- Mark Topic as New
- Mark Topic as Read
- Float this Topic for Current User
- Bookmark
- Subscribe
- Mute
- Printer Friendly Page
- Mark as New
- Bookmark
- Subscribe
- Mute
- Subscribe to RSS Feed
- Permalink
- Report Inappropriate Content
customized duration format
Hello,
I have a data which contents a number of minutes (a duration). I would like to present it in a friendly way, and keep it numeric so I can build graphics.
The best result I manage to get is:
=interval(interval#(sum(DURATION_MINUTE) , 'm'), 'Dj hh:mm') which gives me 2j 11:34 for instance ('j' stands for 'day' in French)
What I would like is to add something like 'h' between the hours and the minutes. Ideally:
2j 11 h 34 min
But if I set the format to 'D j hh h mm min' the whole 'h' and 'm' characters are interpreted as format chars, not just chars to be displayed: which gives: 2 j 11 11 34 3in
Of course I can calculate the nb of days, hours and minutes, and build a concatenated string, but then it is not a number anymore. It could possibly be acceptable in a table, but no way to build a graphic.
Does someone know a solution to customize the output format?
Rgds
Pascal
- Mark as New
- Bookmark
- Subscribe
- Mute
- Subscribe to RSS Feed
- Permalink
- Report Inappropriate Content
What if you use a dual function here?
Dual(withconcatfunction, withoutconcatfunction(actualtimestamp))
This will solve both your purpose, right?
HTH
Best,
Sunny
- Mark as New
- Bookmark
- Subscribe
- Mute
- Subscribe to RSS Feed
- Permalink
- Report Inappropriate Content
Hi,
one example using the proposed dual()-function could be:
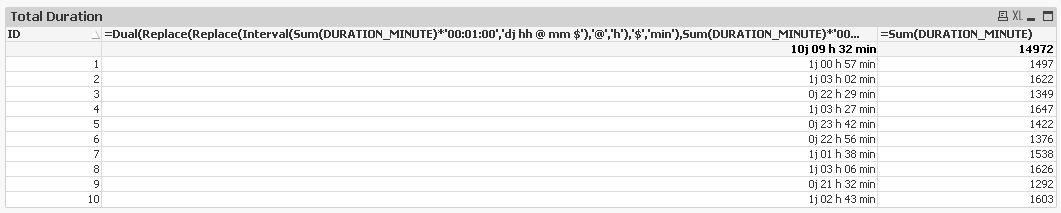
=Dual(Replace(Replace(Interval(Sum(DURATION_MINUTE)*'00:01:00','dj hh @ mm $'),'@','h'),'$','min'),Sum(DURATION_MINUTE)*'00:01:00')
hope this helps
regards
Marco
- Mark as New
- Bookmark
- Subscribe
- Mute
- Subscribe to RSS Feed
- Permalink
- Report Inappropriate Content
That seems to be the good solution indeed. I didn't know this function. Very flexible!
Now, there is still a last issue: in the graphs, the scale is displayed with the numeric value (that's pretty logical as the graph itself is built with numeric), not the formatted value.
Do you see any way to force the scale to be displayed as the formatted value?
Rgds
Pascal