Unlock a world of possibilities! Login now and discover the exclusive benefits awaiting you.
- Qlik Community
- :
- All Forums
- :
- QlikView App Dev
- :
- Reference Line as Qty in Horizontal Bar Chart
- Subscribe to RSS Feed
- Mark Topic as New
- Mark Topic as Read
- Float this Topic for Current User
- Bookmark
- Subscribe
- Mute
- Printer Friendly Page
- Mark as New
- Bookmark
- Subscribe
- Mute
- Subscribe to RSS Feed
- Permalink
- Report Inappropriate Content
Reference Line as Qty in Horizontal Bar Chart
Hello, I'm trying to get the vertical reference line in my chart as shown below. I have defined the reference line with the appropriate expressions and selections for Primary 1 and 2, but the reference line remains at the 0 mark. Any ideas?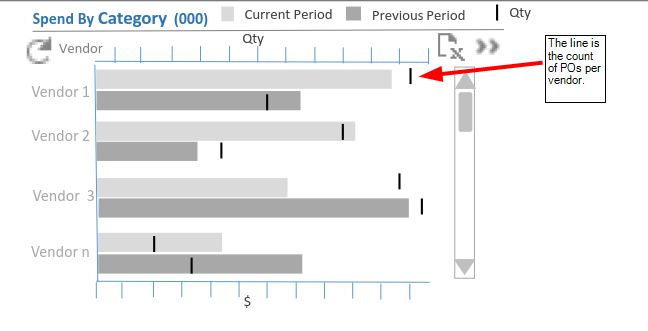
Thank you,
-P
- Tags:
- new_to_qlikview
- Mark as New
- Bookmark
- Subscribe
- Mute
- Subscribe to RSS Feed
- Permalink
- Report Inappropriate Content
- Mark as New
- Bookmark
- Subscribe
- Mute
- Subscribe to RSS Feed
- Permalink
- Report Inappropriate Content
Perhaps you can use error bars. See this blog post: Bar chart target lines in QlikView The Qlik Fix!
talk is cheap, supply exceeds demand
- Mark as New
- Bookmark
- Subscribe
- Mute
- Subscribe to RSS Feed
- Permalink
- Report Inappropriate Content
I pasted the same link and it went to moderation. How did you manage to surpass the moderation??? 
- Mark as New
- Bookmark
- Subscribe
- Mute
- Subscribe to RSS Feed
- Permalink
- Report Inappropriate Content
I've got special magic dust to sprinkle on the links to make them smell good to the spam filter  .
.
In other words I think I've been given a privilege by the site admins so that posts of mine bypass the moderation queue mostly.
talk is cheap, supply exceeds demand
- Mark as New
- Bookmark
- Subscribe
- Mute
- Subscribe to RSS Feed
- Permalink
- Report Inappropriate Content
Sweet!
- Mark as New
- Bookmark
- Subscribe
- Mute
- Subscribe to RSS Feed
- Permalink
- Report Inappropriate Content
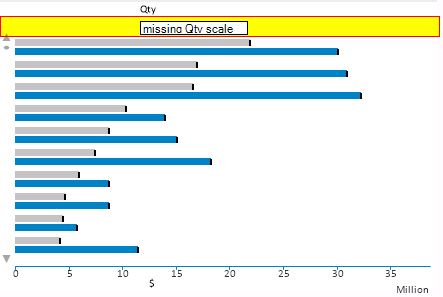
HI, Thank you for the quick response. Unfortunately this does not work for me. The Qty is a separate measure not related to the $ value. When I implement the error bars, not only do they all display at the end of each vendor line, I have also lost my axis at the top which gave the Qty values.
- Mark as New
- Bookmark
- Subscribe
- Mute
- Subscribe to RSS Feed
- Permalink
- Report Inappropriate Content
Hello Everyone- In the same requirement i want to find out the 1st po date and 1st po Qty
to get the 1st po date i am doing min(po date) which is working fine
but to get the 1st po qty i am trying to do
=Alt(FirstSortedValue(Aggr(Sum([Qty On Order]), [Item Number], [Promise Date]), [Promise Date]), Aggr(Sum([Qty On Order]), [Item Number], [Promise Date]))
=Sum({<[Promise Date] = {"$(=Min([Promise Date]))"}>} [Qty On Order])
Both the expressions are not working for me please give me some suggetions how to get the 1st PO Qty for that item.
the other thing happening =Sum({<[Promise Date] = {"$(=Min([Promise Date]))"}>} [Qty On Order]) with this expression is that it is working only if i select one item, and is displaying all over when no item is selected in the chart.