Unlock a world of possibilities! Login now and discover the exclusive benefits awaiting you.
- Qlik Community
- :
- All Forums
- :
- QlikView App Dev
- :
- how to create a YTD visualization ?
- Subscribe to RSS Feed
- Mark Topic as New
- Mark Topic as Read
- Float this Topic for Current User
- Bookmark
- Subscribe
- Mute
- Printer Friendly Page
- Mark as New
- Bookmark
- Subscribe
- Mute
- Subscribe to RSS Feed
- Permalink
- Report Inappropriate Content
how to create a YTD visualization ?
How to make a visualization showing YTD Sales of each Salesman.
Accepted Solutions
- Mark as New
- Bookmark
- Subscribe
- Mute
- Subscribe to RSS Feed
- Permalink
- Report Inappropriate Content
LOAD
InYearToDate(MakeDate(Year,Month), Today(), 0) as YTD,
Year,
Month,
Product,
Sales,
Salesman,
Area,
Count
FROM
RobSalesFact.csv
(txt, codepage is 1252, embedded labels, delimiter is ',', msq);
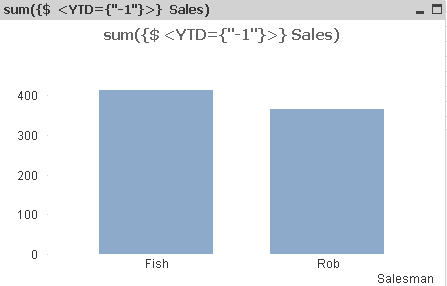
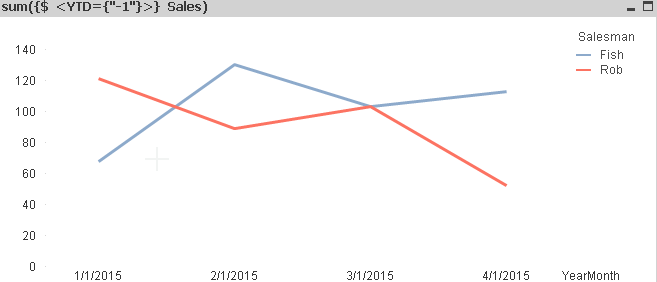
or this (same expression), dimensions YearMonth and Salesman
- Mark as New
- Bookmark
- Subscribe
- Mute
- Subscribe to RSS Feed
- Permalink
- Report Inappropriate Content
LOAD
InYearToDate(MakeDate(Year,Month), Today(), 0) as YTD,
Year,
Month,
Product,
Sales,
Salesman,
Area,
Count
FROM
RobSalesFact.csv
(txt, codepage is 1252, embedded labels, delimiter is ',', msq);
or this (same expression), dimensions YearMonth and Salesman
- Mark as New
- Bookmark
- Subscribe
- Mute
- Subscribe to RSS Feed
- Permalink
- Report Inappropriate Content
thanks a lot.
but my requirement is like, the bar chart should not affect when i select any year or month.
the chart should respond to only selection of columns other than year and month.
- Mark as New
- Bookmark
- Subscribe
- Mute
- Subscribe to RSS Feed
- Permalink
- Report Inappropriate Content
Hi,
Nullify the field which you want not to affect on expression
like
Sum({<YTD={"-1"},Year=,Month=>}Sales)
Regards
Please appreciate our Qlik community members by giving Kudos for sharing their time for your query. If your query is answered, please mark the topic as resolved 🙂
- Mark as New
- Bookmark
- Subscribe
- Mute
- Subscribe to RSS Feed
- Permalink
- Report Inappropriate Content
hey ! it works
thanks alot