Unlock a world of possibilities! Login now and discover the exclusive benefits awaiting you.
- Qlik Community
- :
- All Forums
- :
- QlikView App Dev
- :
- Bar chart
- Subscribe to RSS Feed
- Mark Topic as New
- Mark Topic as Read
- Float this Topic for Current User
- Bookmark
- Subscribe
- Mute
- Printer Friendly Page
- Mark as New
- Bookmark
- Subscribe
- Mute
- Subscribe to RSS Feed
- Permalink
- Report Inappropriate Content
Bar chart
Hi All,
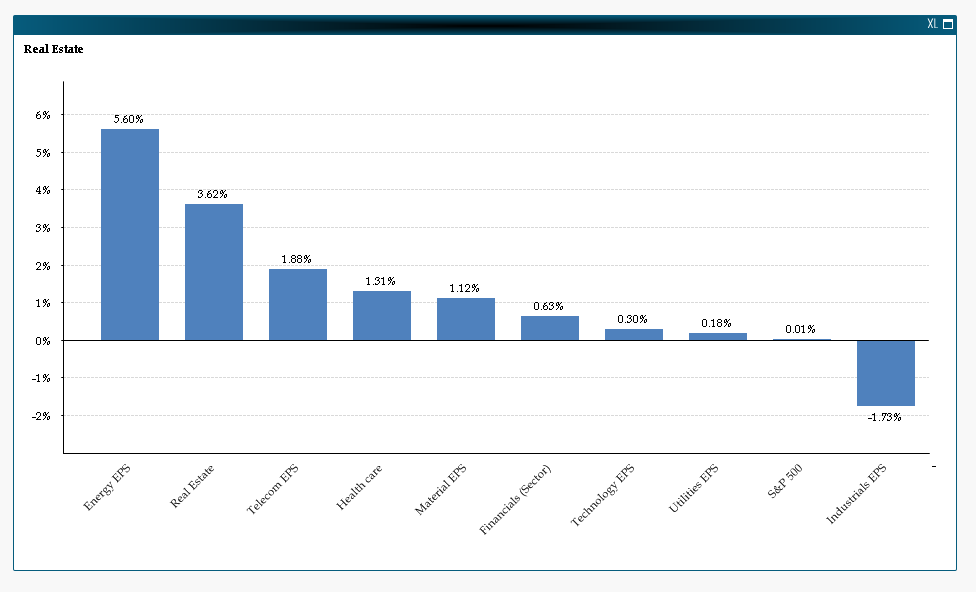
Please find sample qvw and attached screenshot.
I need to show names on bar chart as shown in attachment.
Can you please suggest which string function shall i use to get bar names as shown in screenshot.
thanks
- « Previous Replies
-
- 1
- 2
- Next Replies »
- Mark as New
- Bookmark
- Subscribe
- Mute
- Subscribe to RSS Feed
- Permalink
- Report Inappropriate Content
Are you referring with regards to the sorting?
- Mark as New
- Bookmark
- Subscribe
- Mute
- Subscribe to RSS Feed
- Permalink
- Report Inappropriate Content
Is this the goal?
If yes then you can sort your dimension by expression in descending order with this expression (which is the same expression as your bar chart expression):
=(Avg({<INDICATOR_NAME={'Real Estate EPS % change','Financials (Sector) EPS % change','Utilities EPS % change','Technology EPS % change','Material EPS % change'
,'S&P 500 Consumer Discretionary Sector Index = Discretionary EPS % change','Telecom EPS % change','Health care EPS % change','S&P 500 EPS % change',
'Industrials EPS % change','S&P 500 Consumer Staples Sector Index = Staples EPS % change','Energy EPS % change'}>}INDICATOR_VALUE))/100
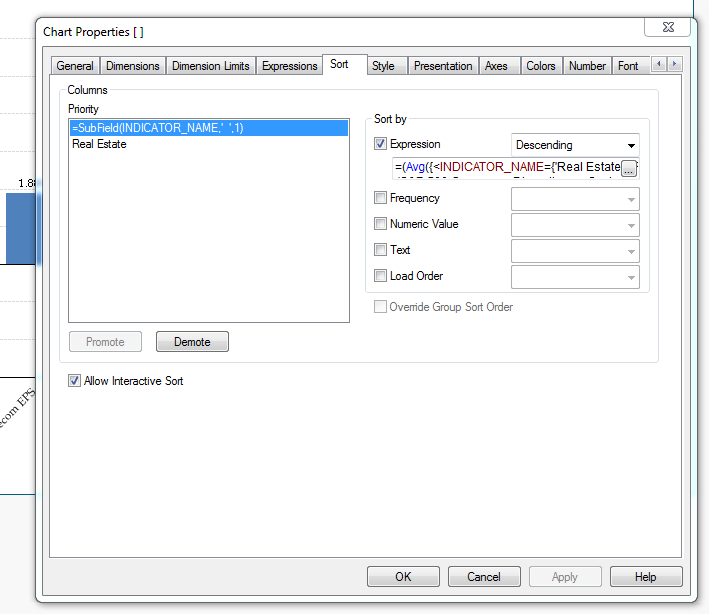
I hope this helps.
Best,
Sunny
- Mark as New
- Bookmark
- Subscribe
- Mute
- Subscribe to RSS Feed
- Permalink
- Report Inappropriate Content
Hi,
I wanted to know which calculated dimension shall i use in my application to get the names as shown in screenshot
thanks
- Mark as New
- Bookmark
- Subscribe
- Mute
- Subscribe to RSS Feed
- Permalink
- Report Inappropriate Content
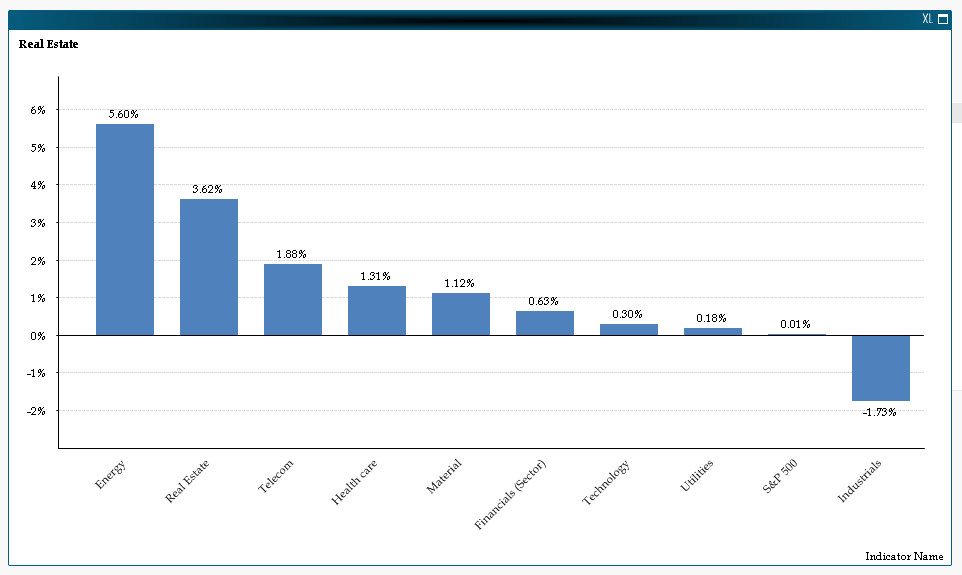
Use this as your calculated dimension:
=Replace(Subfield(INDICATOR_NAME,' ',1) & ' ' & Subfield(INDICATOR_NAME,' ',2), ' EPS', '')
Output:
- Mark as New
- Bookmark
- Subscribe
- Mute
- Subscribe to RSS Feed
- Permalink
- Report Inappropriate Content
Thanks sunindia but I want to show Financials(sector) as only Financials also
- Mark as New
- Bookmark
- Subscribe
- Mute
- Subscribe to RSS Feed
- Permalink
- Report Inappropriate Content
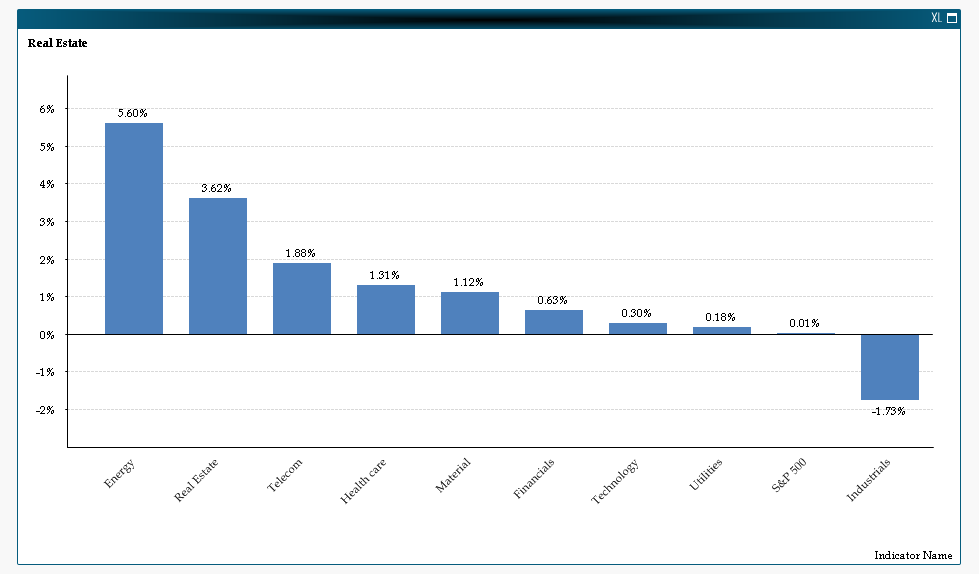
This may be:
=Replace(Replace(Subfield(INDICATOR_NAME,' ',1) & ' ' & Subfield(INDICATOR_NAME,' ',2), ' EPS', ''), '(Sector)', '')
Another simpler solution would be to do this in the script using a mapping load.
HTH
Best,
Sunny
- Mark as New
- Bookmark
- Subscribe
- Mute
- Subscribe to RSS Feed
- Permalink
- Report Inappropriate Content
Thanks Suninda for your promp reply.
Can you please suggest how mapping load would work in this case
- Mark as New
- Bookmark
- Subscribe
- Mute
- Subscribe to RSS Feed
- Permalink
- Report Inappropriate Content
I added this to your script:
Table:
Add LOAD * Inline [ \\ I used add because I needed to do a partial reload, in your case you won't need Add here
INDICATOR_NAME, NEW_INDICATOR_NAME
Real Estate EPS % change, Real Estate
Financials (Sector) EPS % change, Financials
Utilities EPS % change, Utilities
Technology EPS % change, Technology
Material EPS % change, Material
S&P 500 Consumer Discretionary Sector Index = Discretionary EPS % change, S&P 500
Telecom EPS % change, Telecom
Health care EPS % change, Healthcare
S&P 500 EPS % change, S&P 500
Industrials EPS % change, Industrials
S&P 500 Consumer Staples Sector Index = Staples EPS % change, S&P 500
Energy EPS % change, Energy
];
Now I can use NEW_INDICATOR_NAME instead of the old one. This was a regular reload, but you can always use a Mapping Load with Apply Map or you can join the above table to your existing fact table.
I hope this helps.
Best,
Sunny
- Mark as New
- Bookmark
- Subscribe
- Mute
- Subscribe to RSS Feed
- Permalink
- Report Inappropriate Content
Thanks Sunindia 
- « Previous Replies
-
- 1
- 2
- Next Replies »