Unlock a world of possibilities! Login now and discover the exclusive benefits awaiting you.
- Qlik Community
- :
- Forums
- :
- Analytics
- :
- New to Qlik Analytics
- :
- Filtering measurement data
Options
- Subscribe to RSS Feed
- Mark Topic as New
- Mark Topic as Read
- Float this Topic for Current User
- Bookmark
- Subscribe
- Mute
- Printer Friendly Page
Turn on suggestions
Auto-suggest helps you quickly narrow down your search results by suggesting possible matches as you type.
Showing results for
Not applicable
2015-06-03
09:47 AM
- Mark as New
- Bookmark
- Subscribe
- Mute
- Subscribe to RSS Feed
- Permalink
- Report Inappropriate Content
Filtering measurement data
Hello guys,
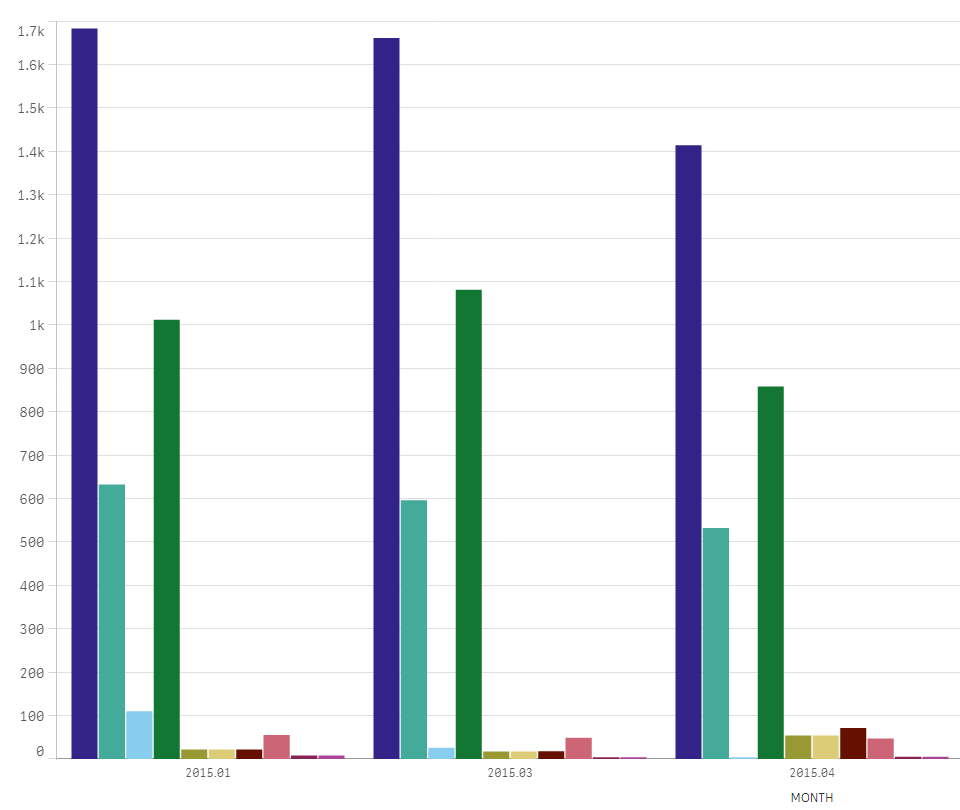
Having a question about data charting. I have created chart where on x axis (dimensions) i see months and on y axis(measurements) i see few different data bars, which is compared to first bar(which is total). How it is possible to do slicer or something like that that i can check which measuremnts i want to see in case i need to see sometimes not all of them?
In the example bellow: main bar is dark blue one and other bars each month is comparisson vs the first one. So how can i select for example to see only green bars vs the main blue bar and not see all other bars that month?
241 Views
0 Replies
Community Browser